Tableau Workshop
SAI VIDYA INSTITUTE OF TECHNOLOGY
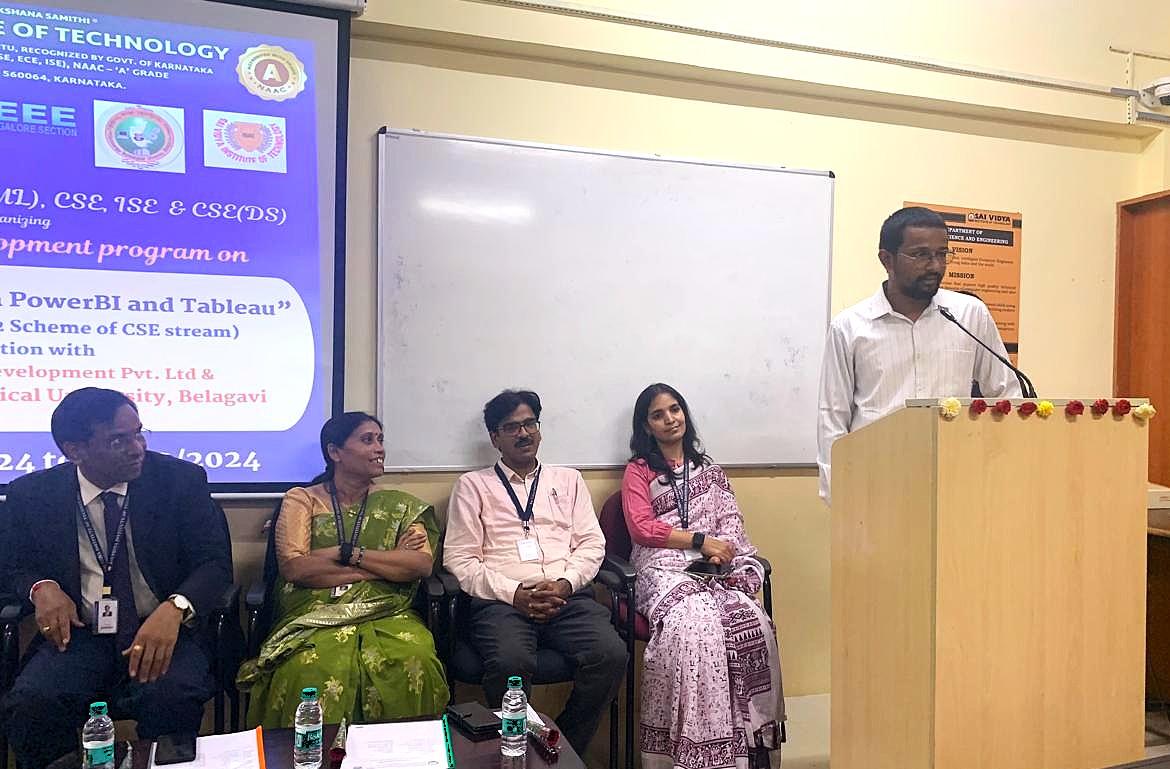
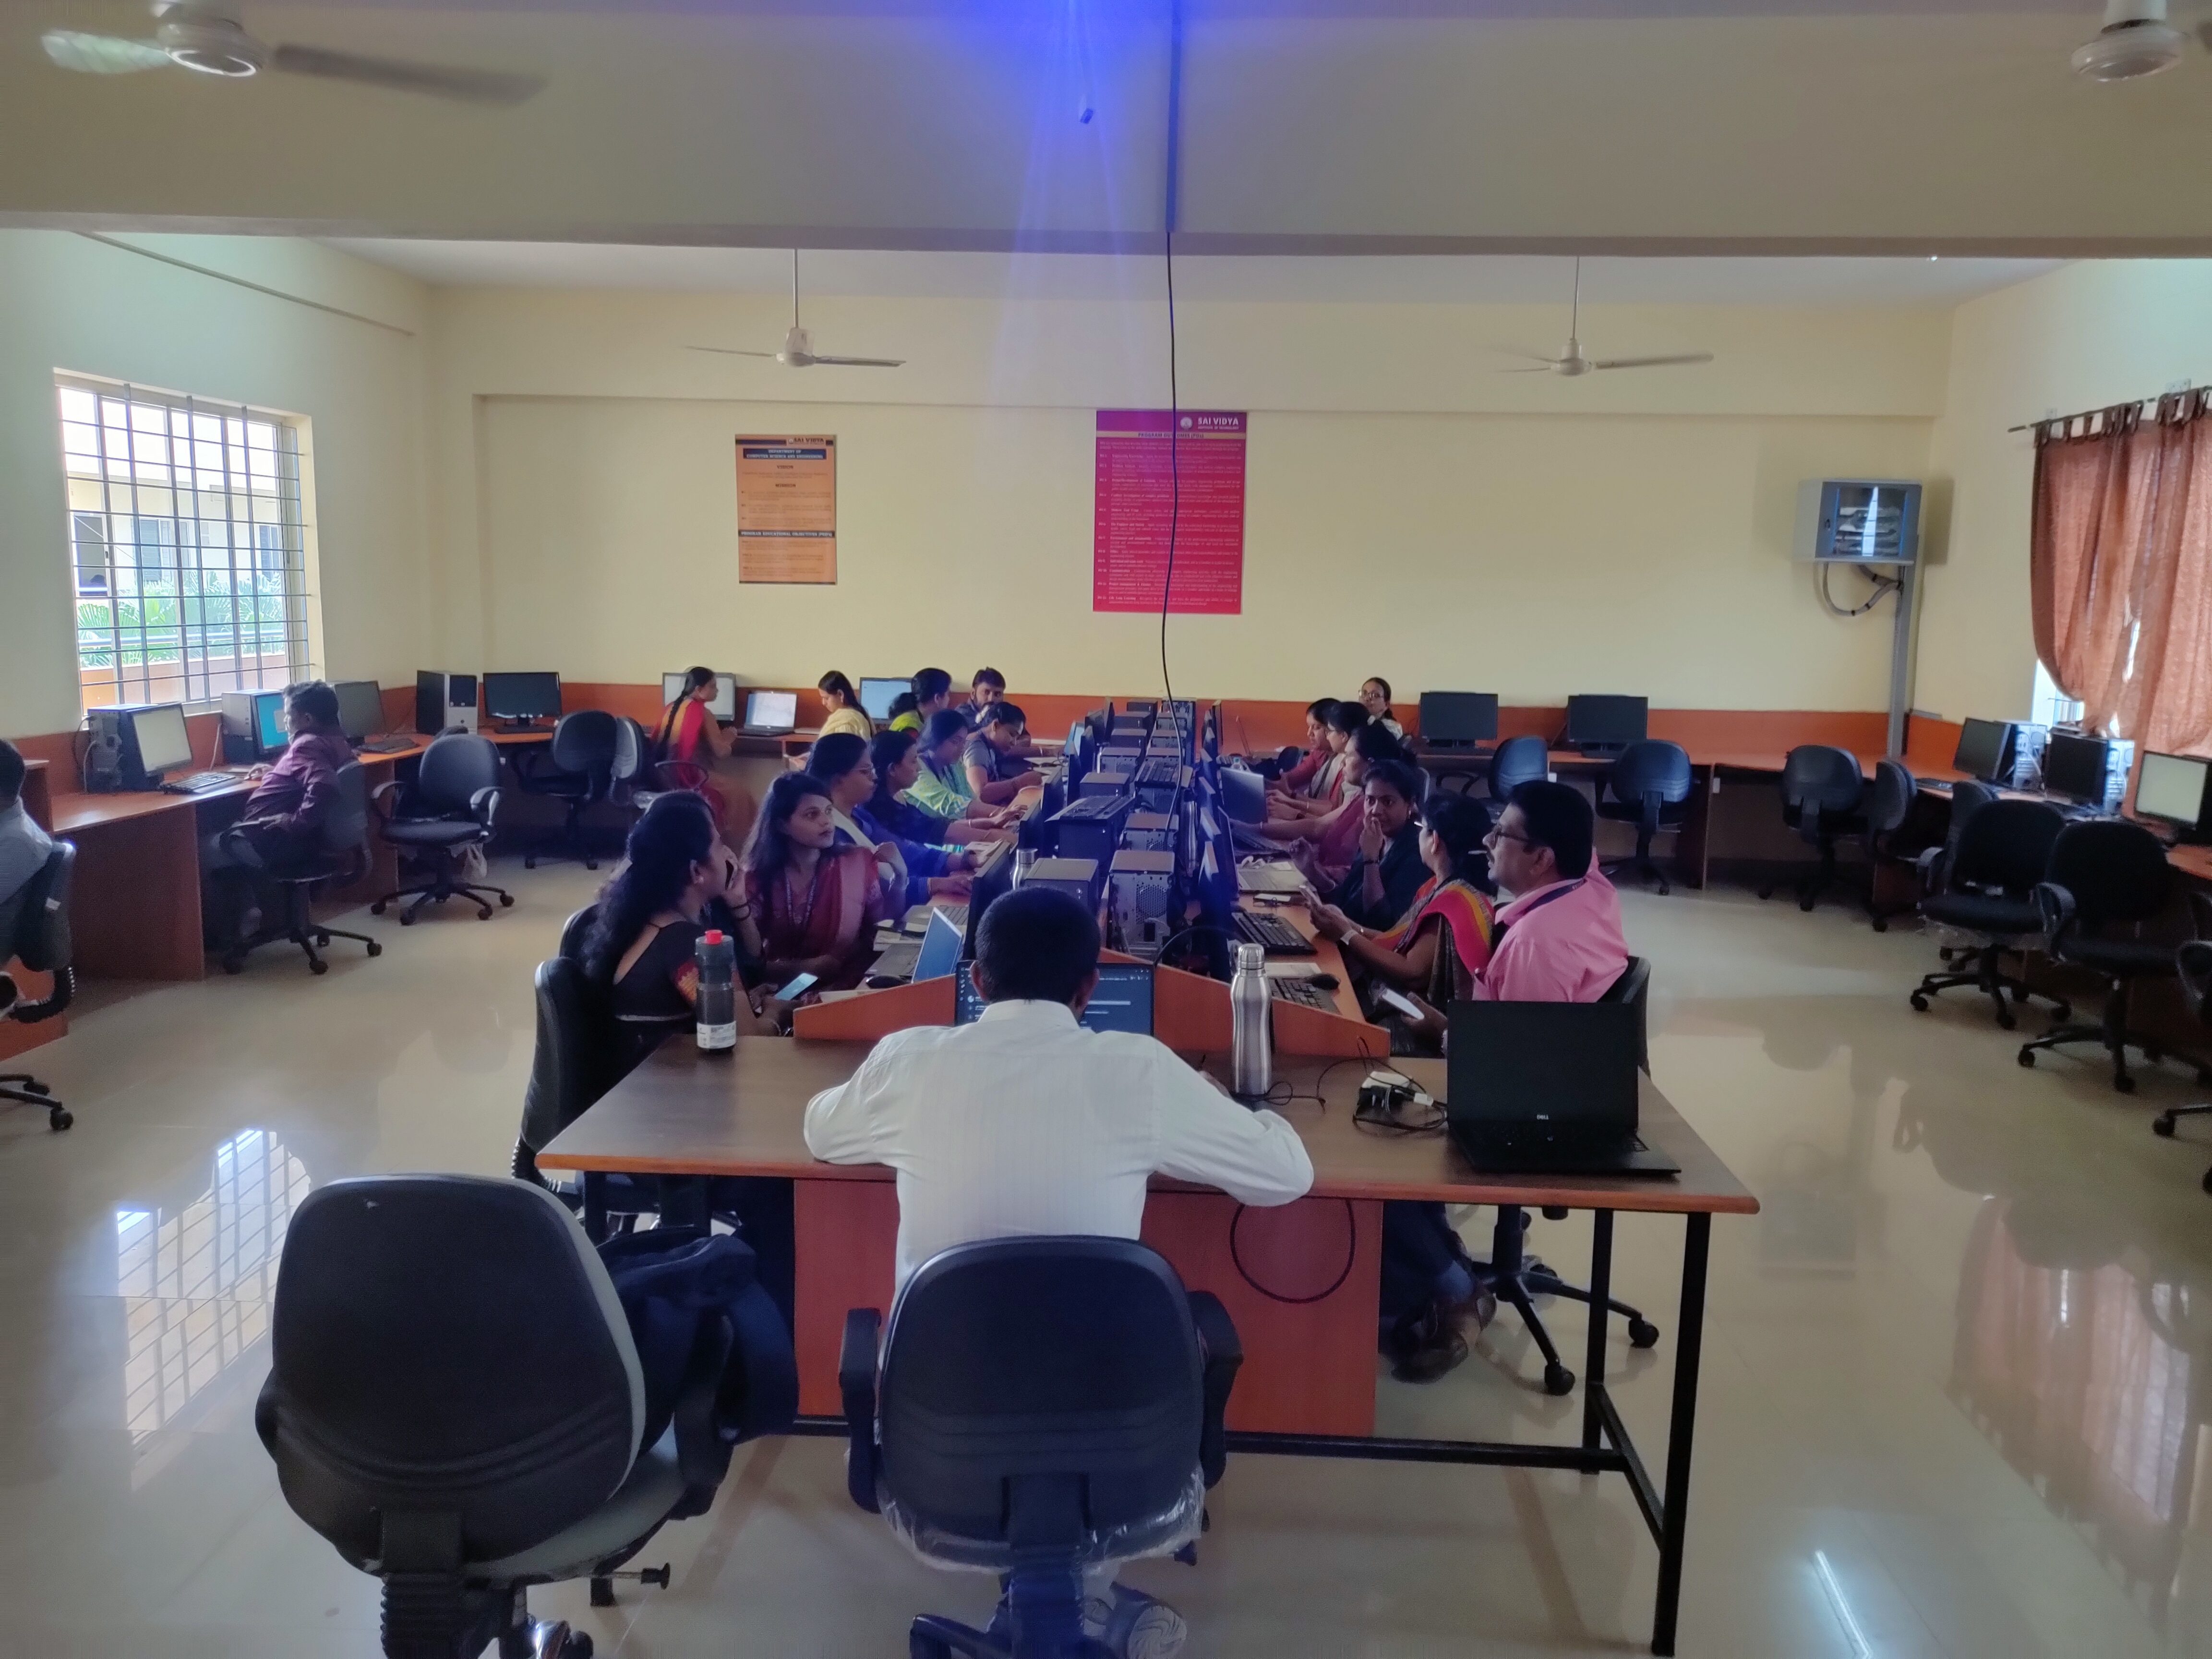
A 3-Day Faculty Development Program on Data Visualization with Power BI and Tableau was conducted at Sai Vidya Institute of Technology (SVIT), Bengaluru under the IEEE student and faculty initiatives. The program, organized by the Departments of CSE (AI & ML), CSE, ISE & CSE(DS), provided participants with hands-on experience in modern data visualization tools. Faculty members explored practical applications in Power BI and Tableau, gaining insights into creating impactful dashboards and data-driven decision-making.
Workshop Highlights
About the Workshop
Overview
A 3-Day Faculty Development Program on Data Visualization with Power BI and Tableau was conducted at Sai Vidya Institute of Technology (SVIT), Bengaluru under the IEEE student and faculty initiatives. The program provided hands-on experience in modern data visualization tools, helping faculty create impactful dashboards and gain insights for data-driven decision-making.
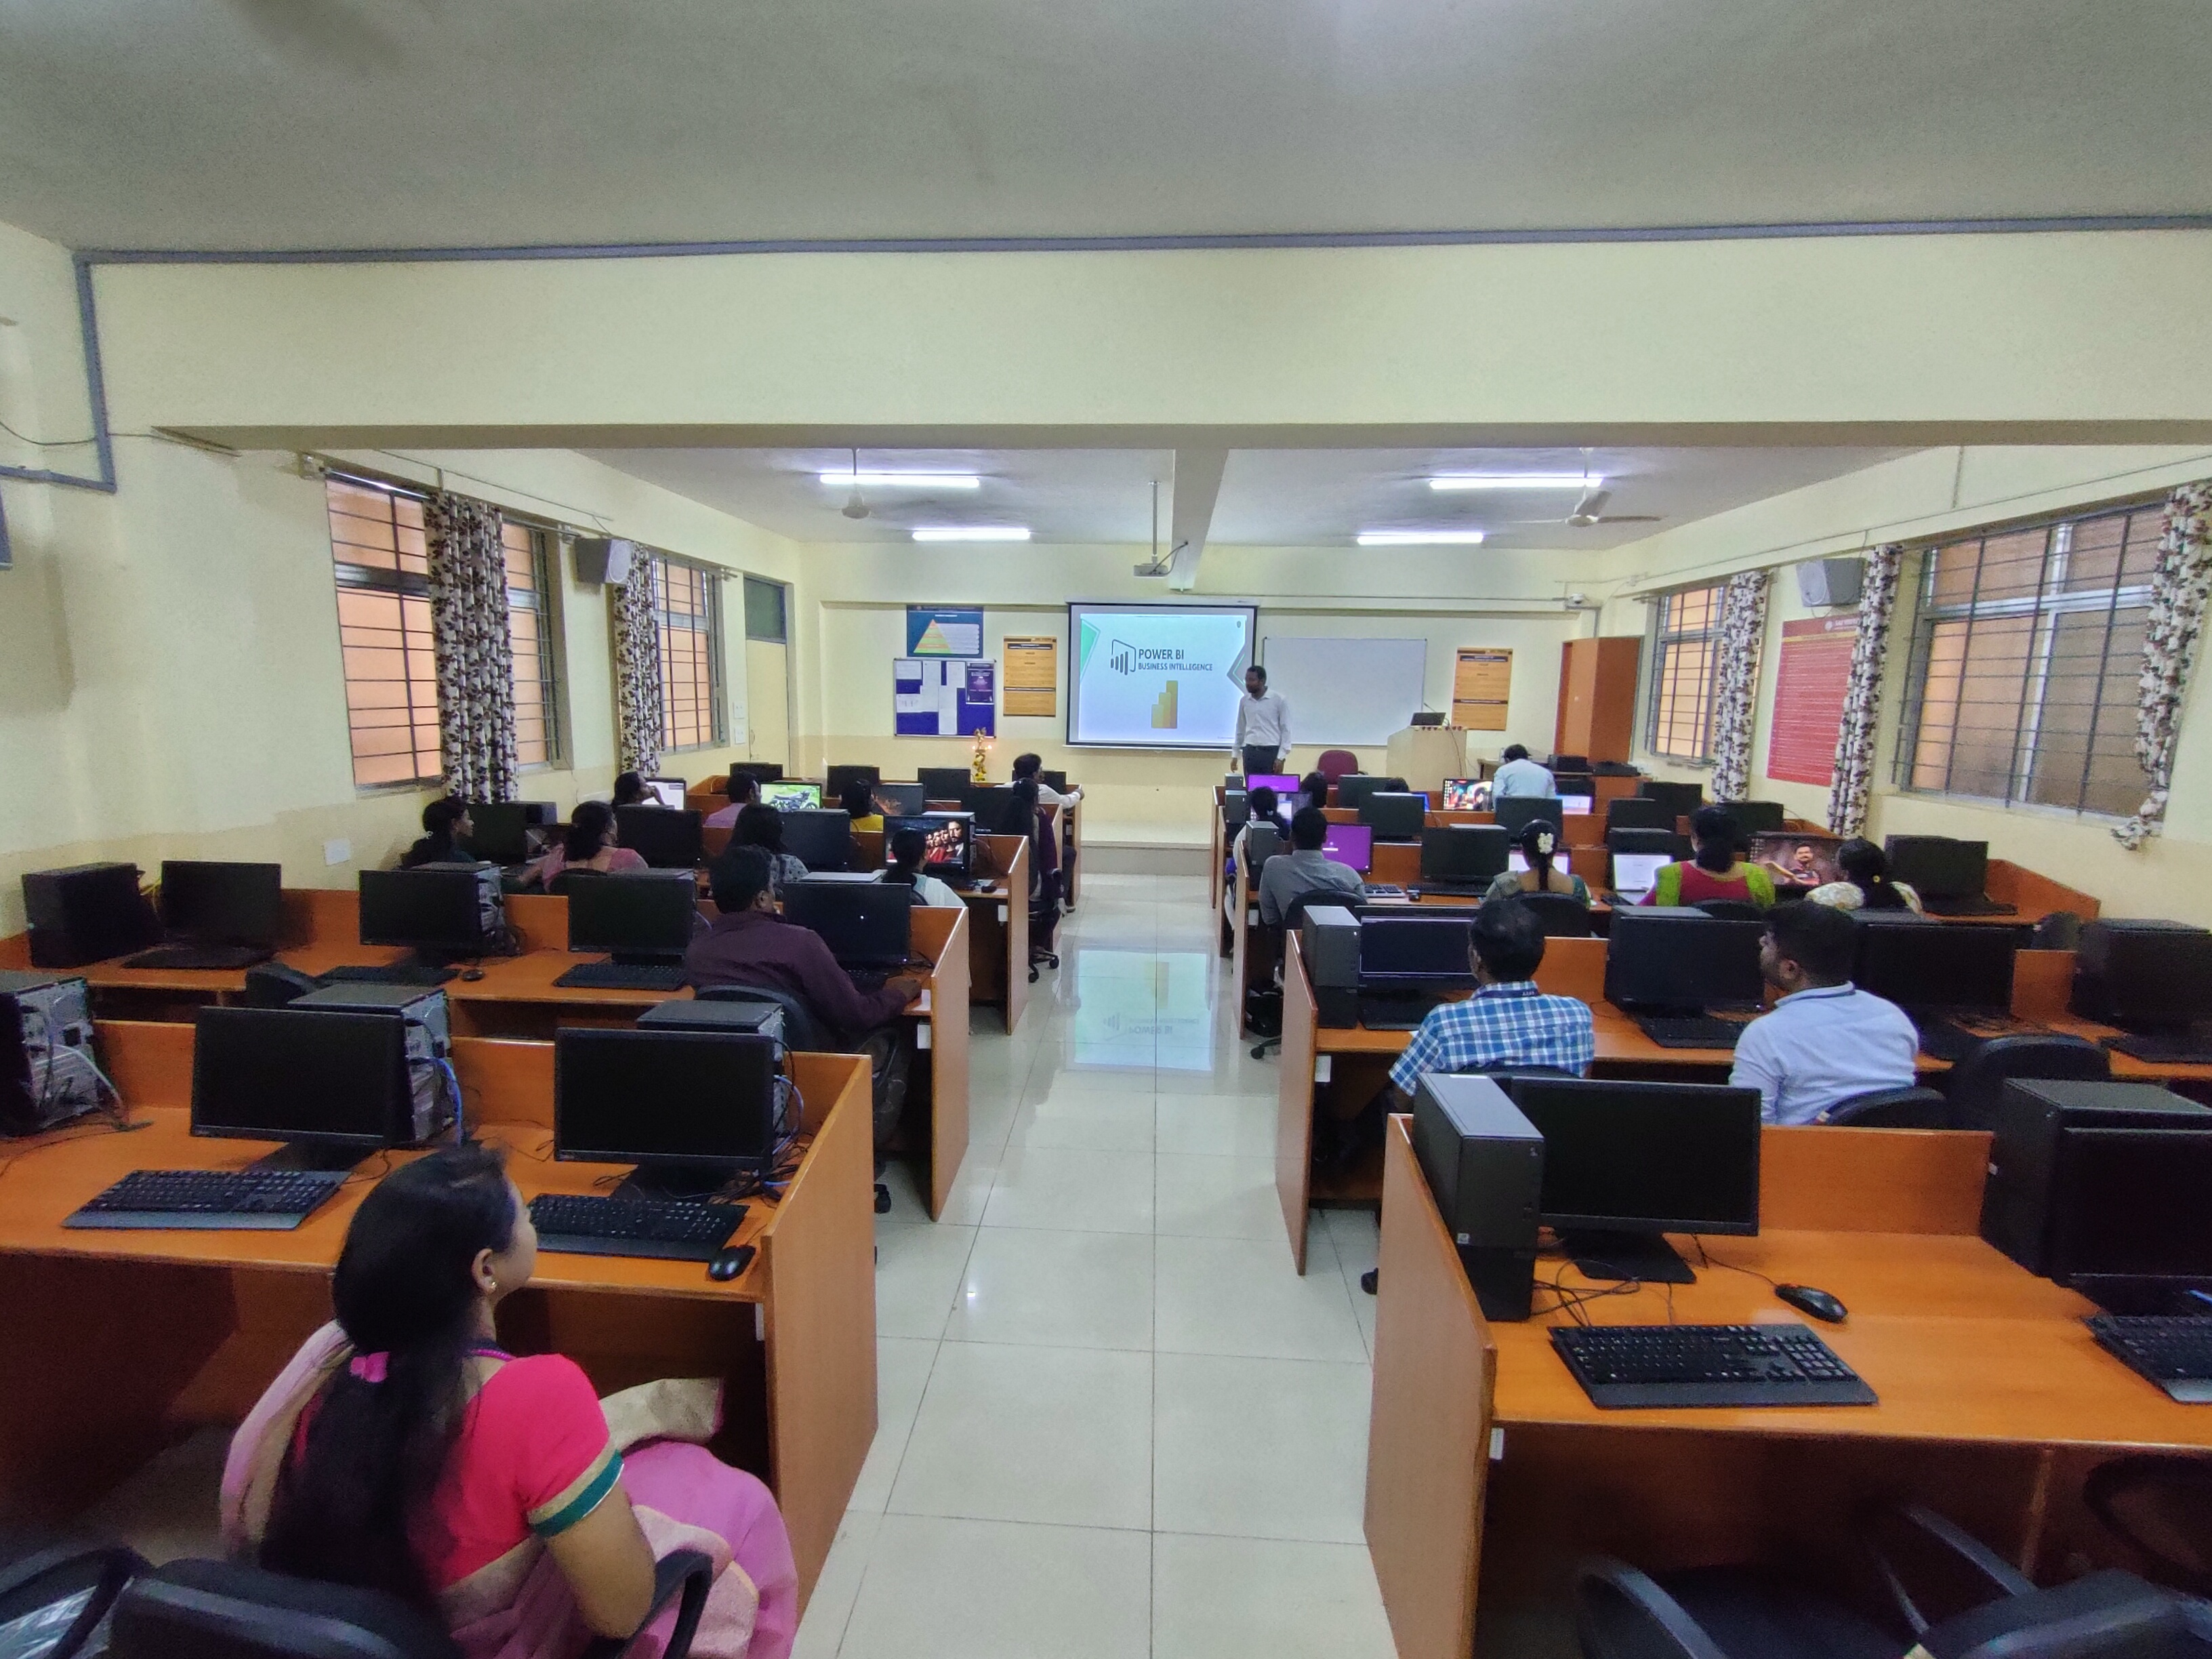
Workshop Applications
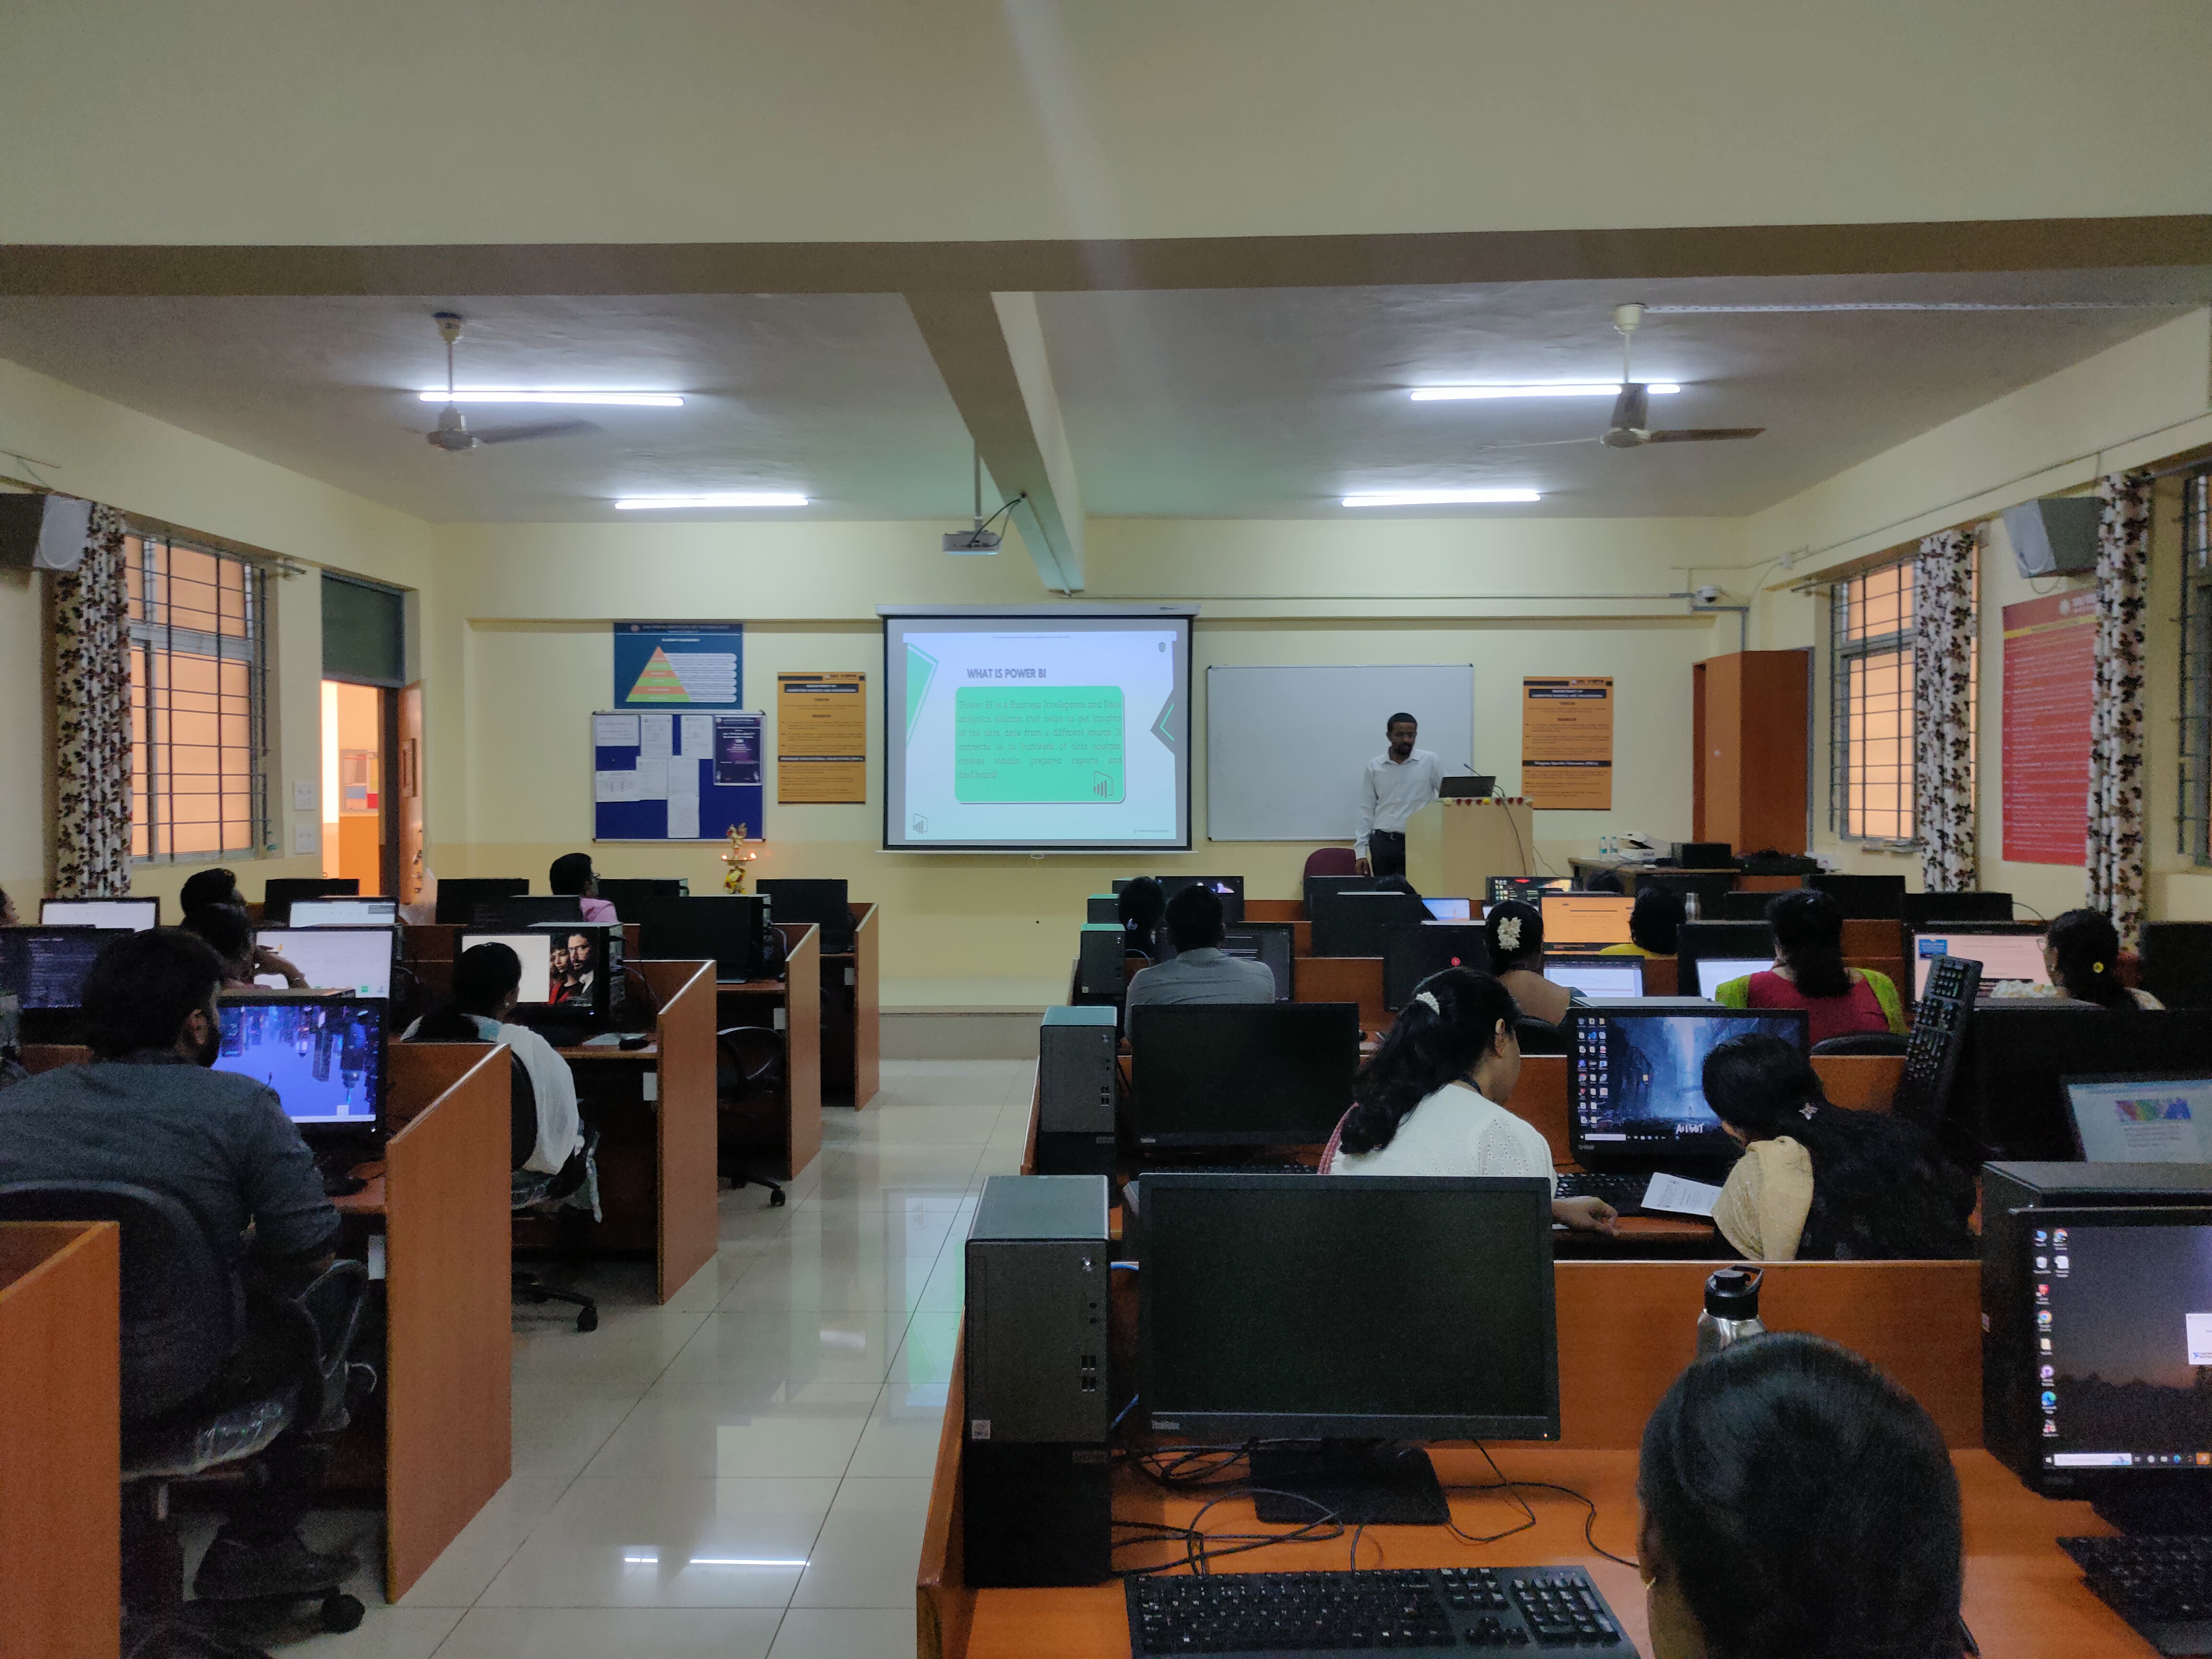
- 💻 Creating interactive dashboards with Power BI
- 💻 Visualizing departmental and academic data with Tableau
- 💻 Analyzing student performance and research metrics
- 💻 Designing reports for insights and decision-making
- 💻 Applying data visualization for data-driven decisions
Participants applied Power BI and Tableau to real-world academic and departmental datasets to develop impactful dashboards and enhance data-driven decision-making skills.
Advanced Capabilities & Outcomes
- Automated data refresh and reporting workflows with Power BI and Tableau
- KPI-driven dashboard design for academic and departmental insights
- Interactive visualizations for real-time data analysis
By the end of the program, participants gained the ability to transform raw academic and departmental data into actionable insights, supporting data-driven decision-making and enhancing analytical skills.
When:
Sep 12–14, 2024
Mode:
In-Person
Participants:
VTU Faculty & Staff
Focus:
Power BI & Tableau
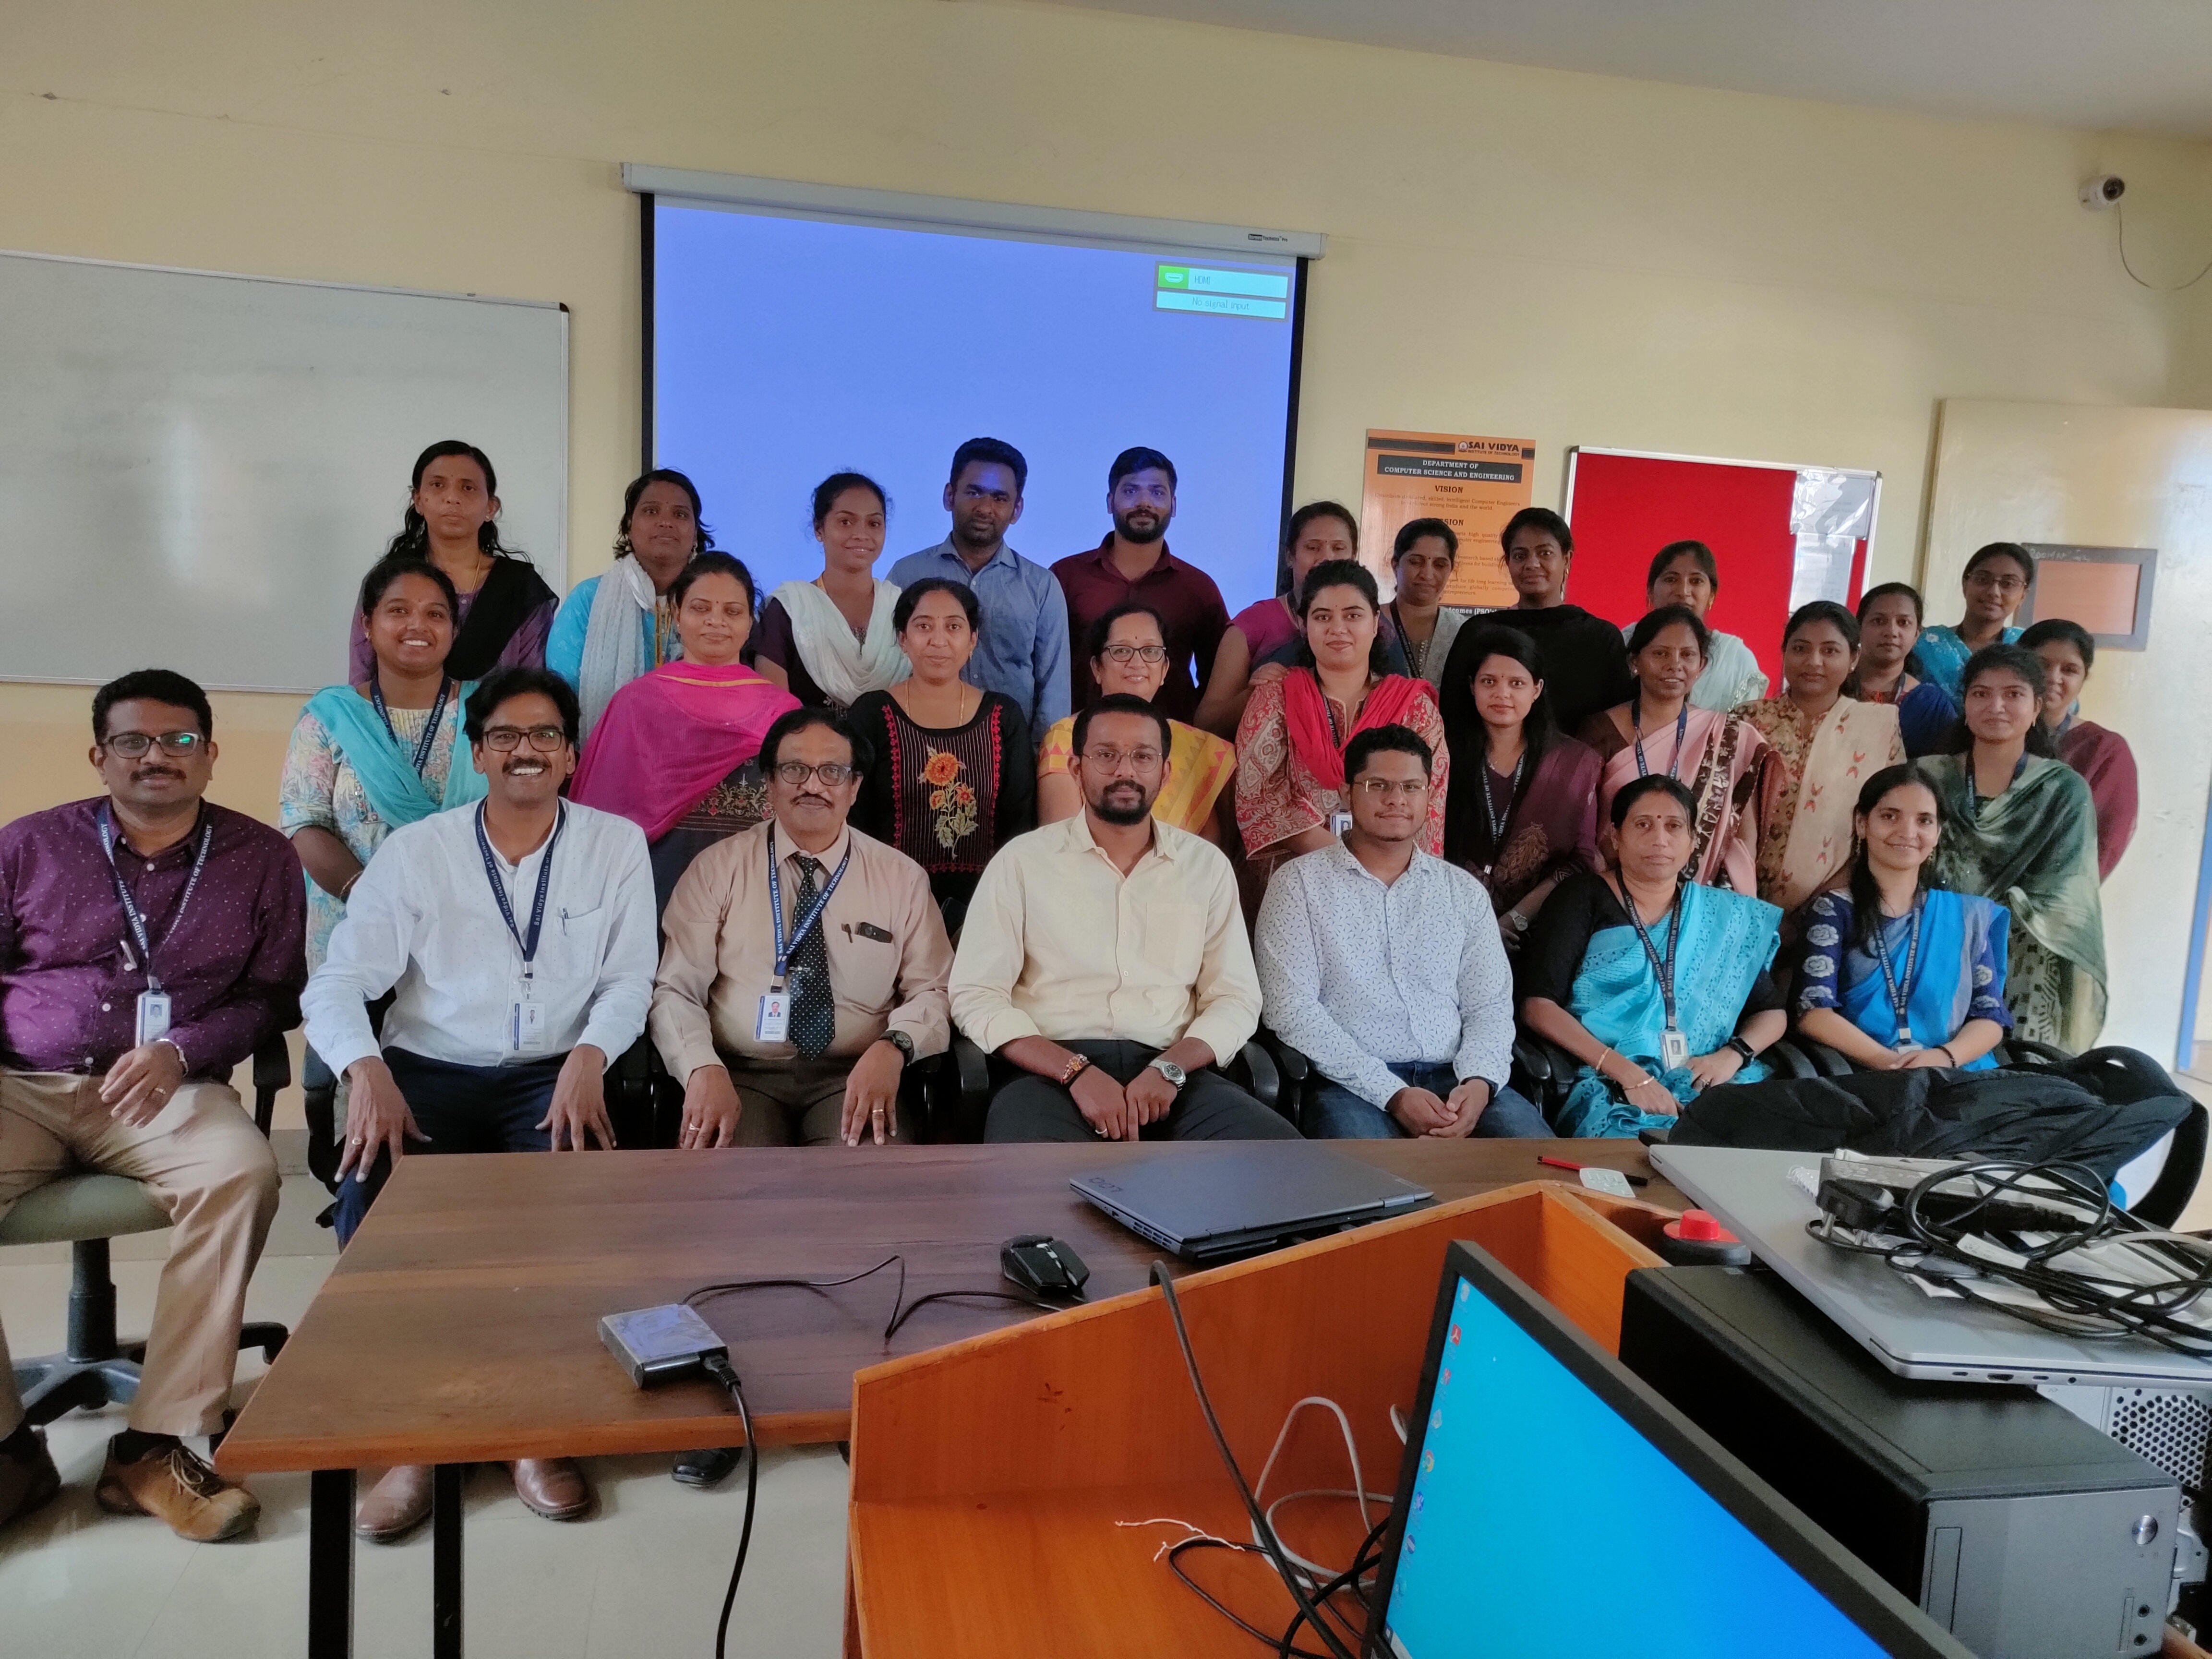
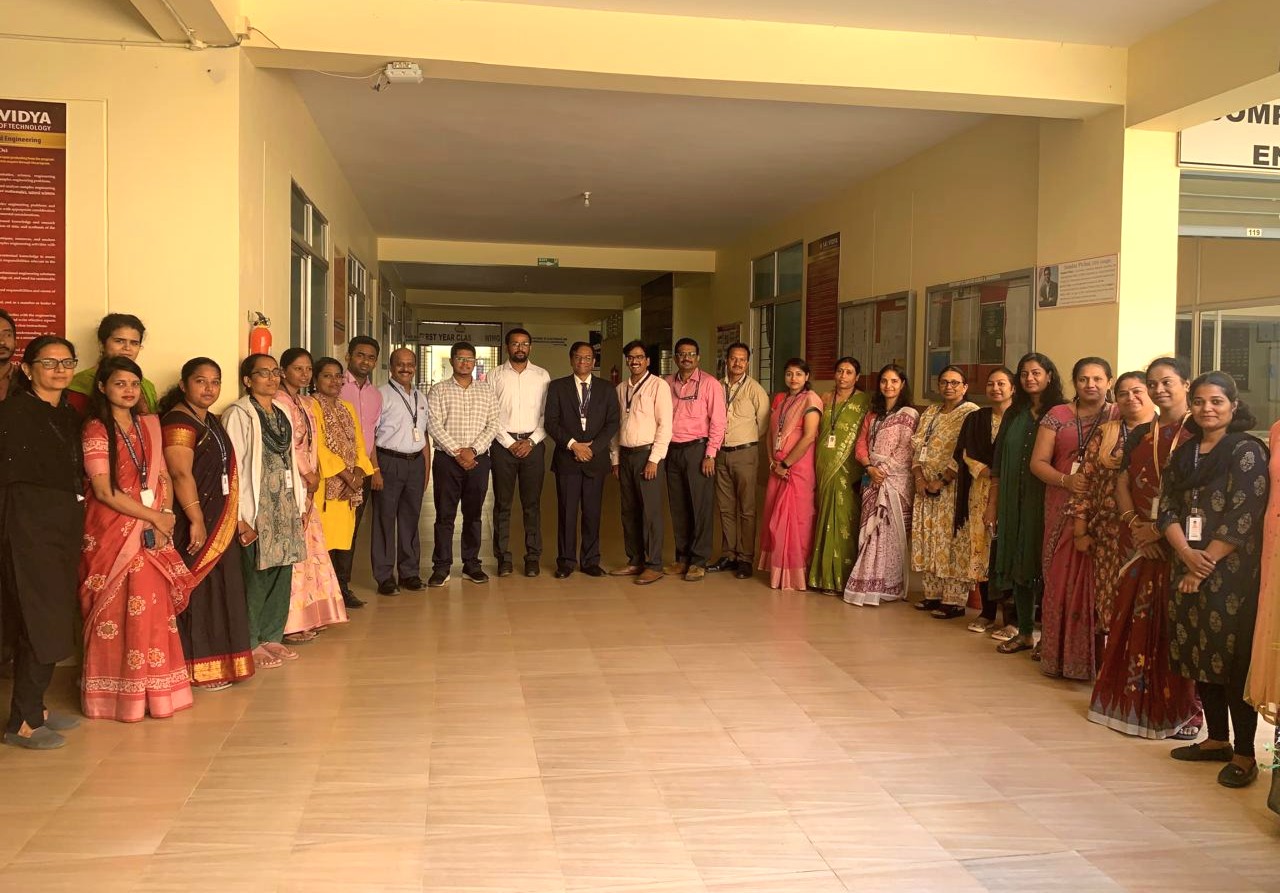
Workshop Moments


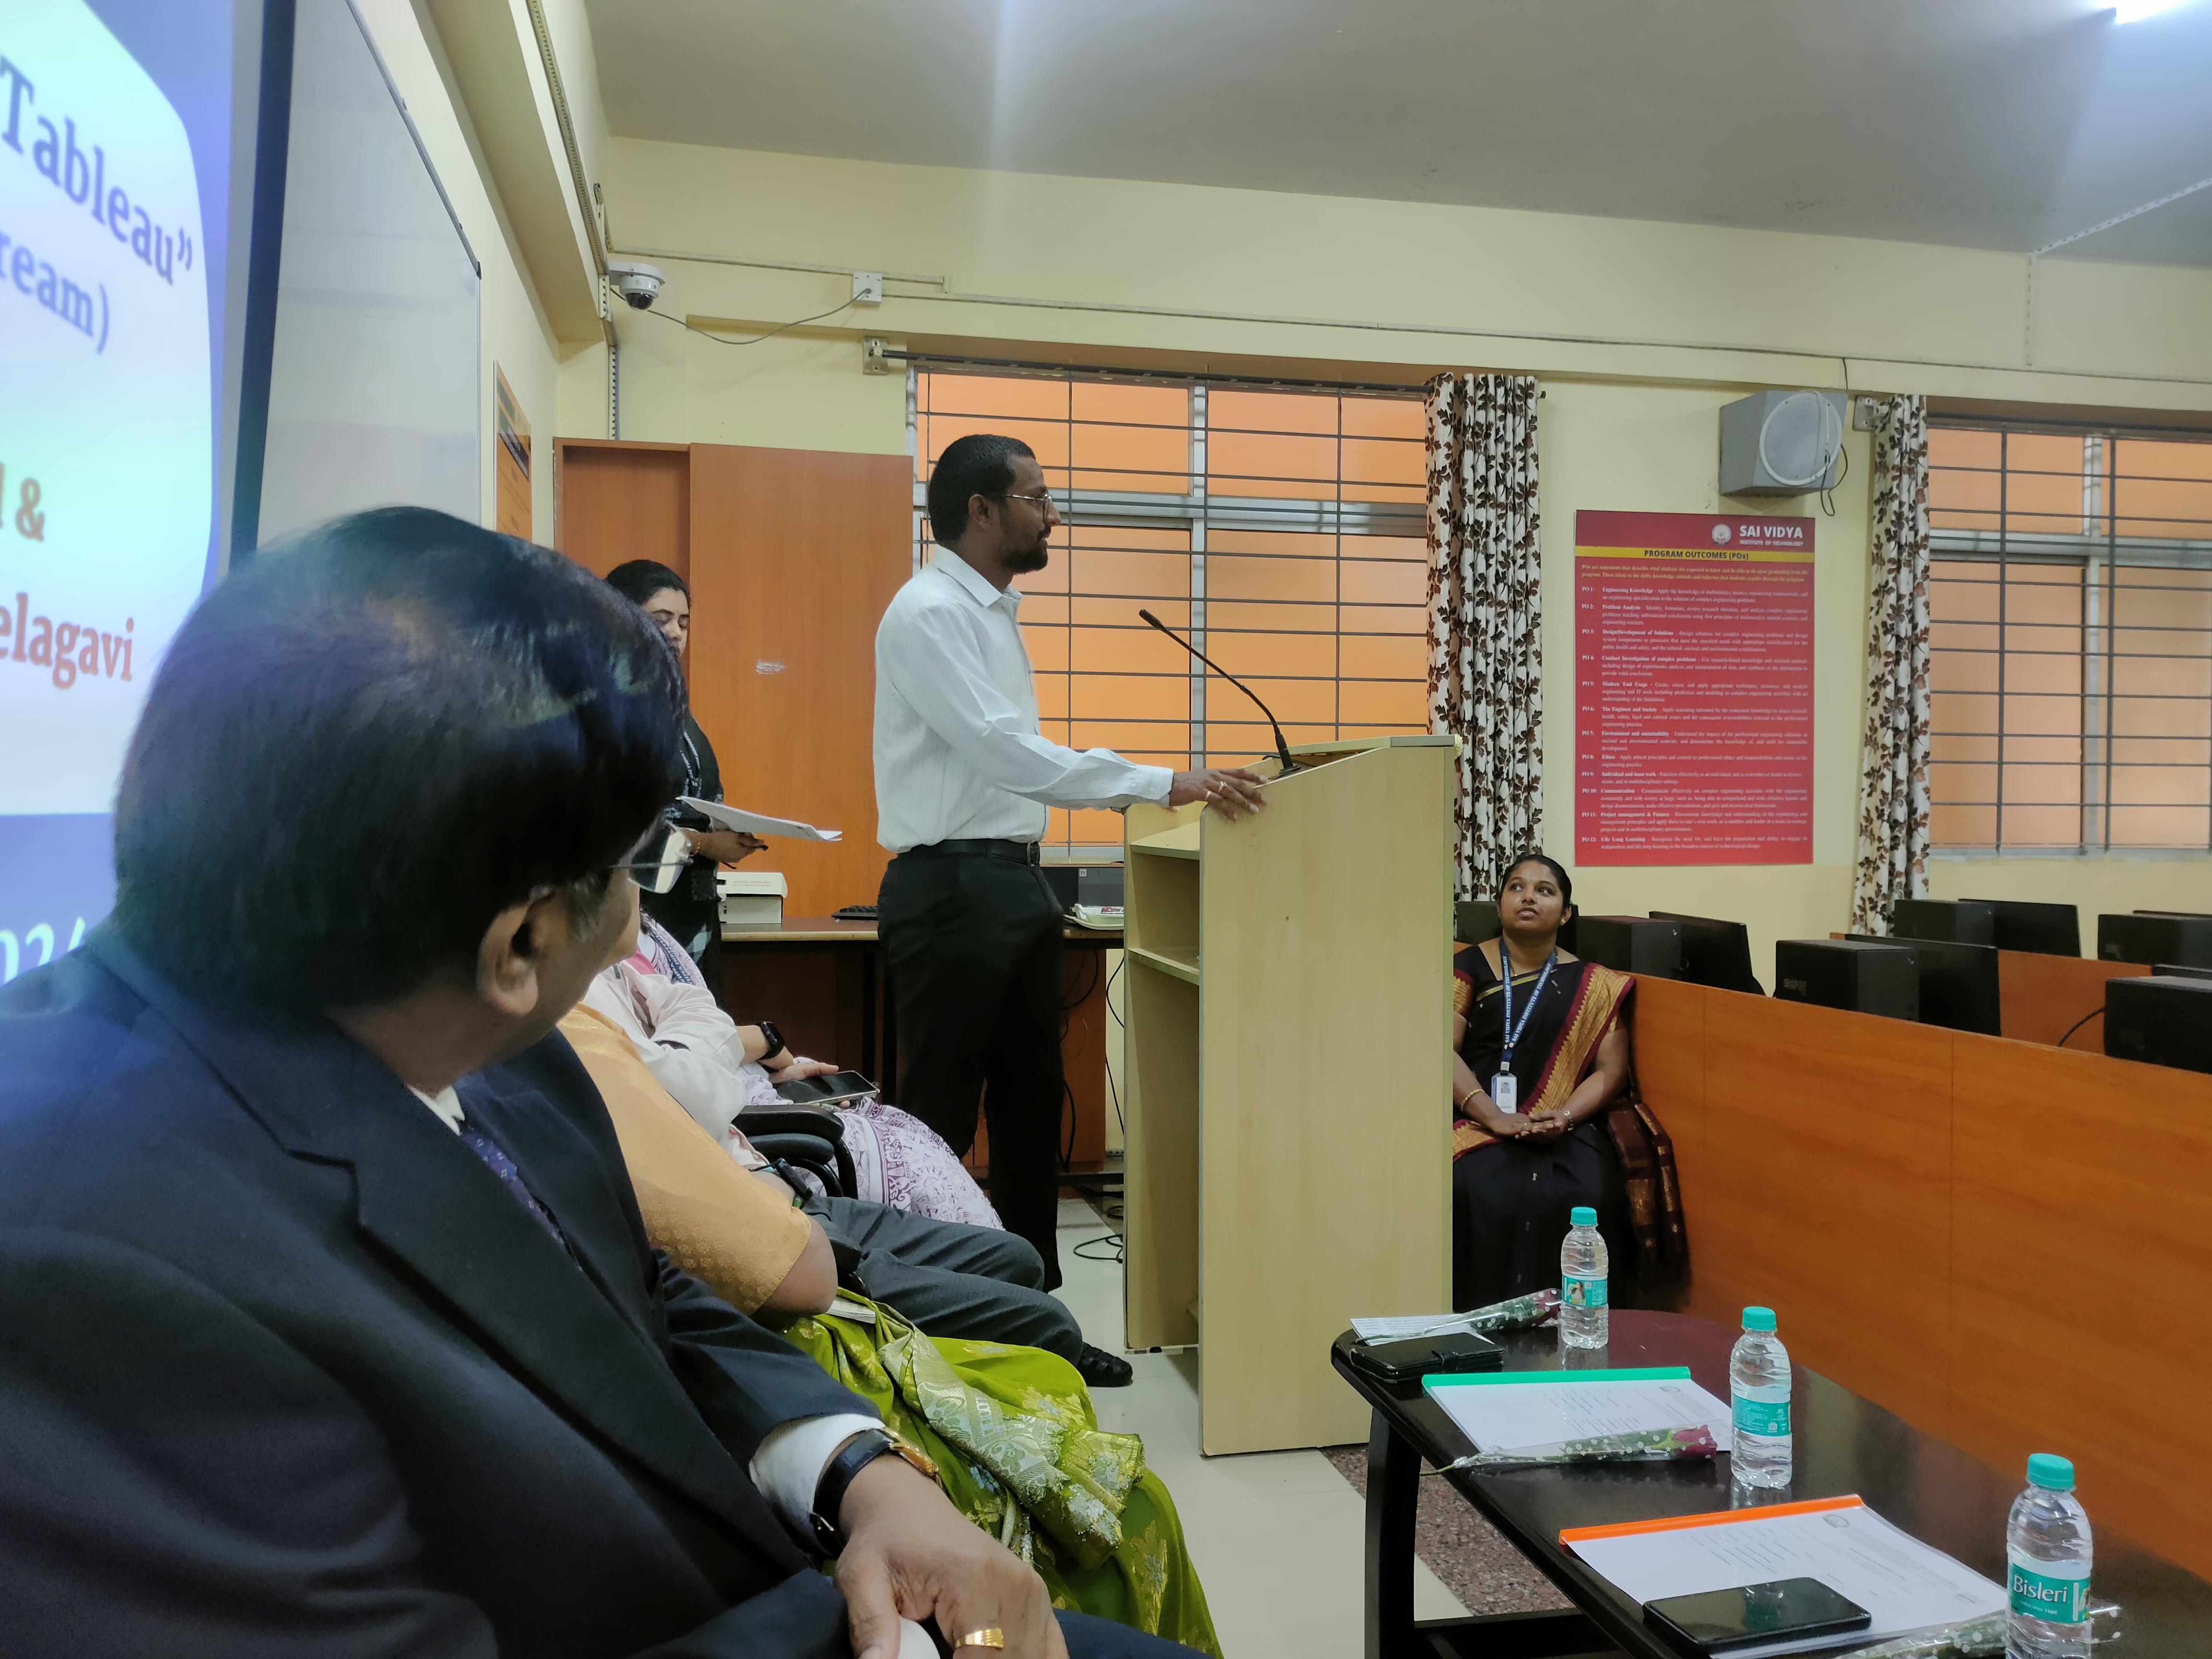
Voices of Faculty
Engaging and insightful! The workshop has enhanced our understanding of data visualization and its application in academic and departmental decision-making.
- Prof. Vani, Data ScienceThe practical exercises with Power BI and Tableau made the learning experience highly relevant. We now have better tools to analyze and present data effectively.
- Prof. Kumarshetty, Data Science