SuperStore Sales Analysis Dashboard
Business Analytics & Sales Insights Project
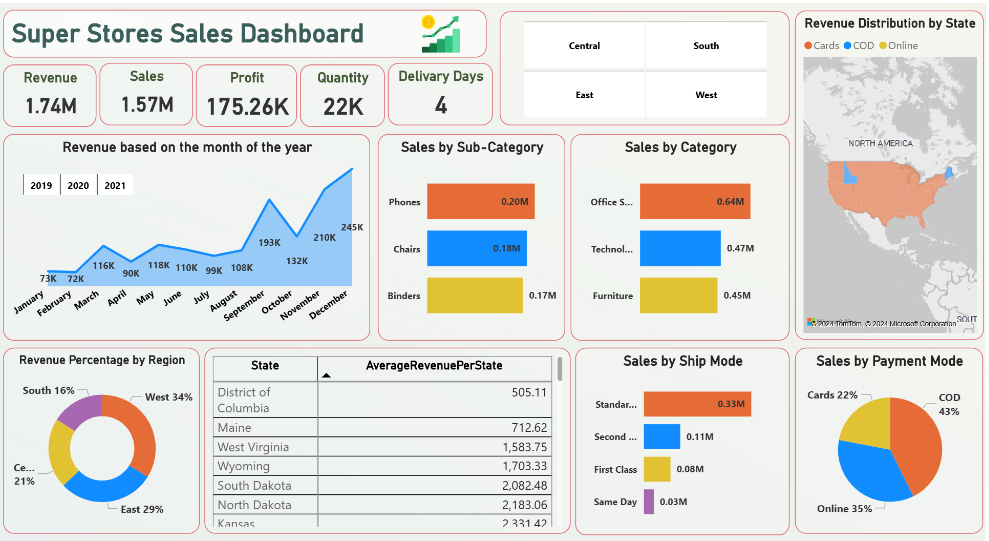
The SuperStore Sales Analysis Dashboard provides a comprehensive analysis of sales data from a fictional SuperStore. It delivers actionable insights into sales trends, profitability, customer behavior, and product performance using Power BI.
The dashboard enables stakeholders to explore data dynamically, uncover patterns, and make data-driven decisions to enhance overall store performance.
Key Features
About the Project
Overview
This Power BI dashboard consolidates SuperStore sales data to provide stakeholders with a clear understanding of performance metrics. Through interactive visualizations, users can explore trends in sales, profitability, customer segments, and product performance to make informed decisions.
Skills Demonstrated
- 🧹 Data Cleaning & Transformation for analysis
- 🔗 Data Modeling with customers, products, and sales relationships
- 📊 DAX Calculations for KPIs, profit margins, and forecasting
- 🎨 Interactive Visualizations with maps, charts, and slicers
- 📖 Data Storytelling for actionable insights
- 🤝 Collaboration & Publishing dashboards to stakeholders


Outcomes & Usefulness
- Identify high-performing products and regions
- Monitor sales trends, seasonality, and profitability
- Make informed decisions on inventory, pricing, and promotions
- Improve overall store performance and revenue generation
When:
2024
Mode:
Power BI Analysis
Dataset:
Fictional SuperStore Sales Data
Focus:
Sales & Business Analytics
Project Snapshots
Business Impact
📈 Identified top-performing products, categories, and regions for actionable business decisions.
💡 Monitored sales trends, customer behavior, and profitability for strategic planning.
⚡ Enabled data-driven recommendations for inventory, pricing, and promotional strategies.
Challenges & Learnings
⚡ Cleaning and transforming multi-dimensional sales data for accurate reporting.
📊 Designing interactive dashboards that deliver clear insights across multiple metrics.
🚀 Learned advanced Power BI modeling, DAX calculations, and data storytelling techniques.