Student Performance Analysis with Power BI
Educational Analytics & Performance Insights
The Student Performance Analysis project analyzes academic data to derive actionable insights aimed at improving educational outcomes. The dataset includes gender, race/ethnicity, parental education, lunch type, test preparation course completion, and scores in math, reading, and writing.
Using Power BI and DAX measures, the project provides detailed visualizations and insights into overall performance, performance gaps, test preparation impact, gender disparities, and parental education influence.
Key Insights & DAX Measures
About the Project
Project Overview
This Power BI dashboard uses DAX measures to analyze student performance data, uncover gaps, and highlight the impact of test preparation and parental education. Stakeholders can interactively explore visualizations to understand trends, disparities, and opportunities for academic improvement.
Usage & Application
- Import the student performance dataset into Power BI.
- Create DAX measures to compute insights like overall performance, gaps, and test preparation impact.
- Use suggested visualizations to effectively communicate findings.
- Support data-driven decision-making to improve educational outcomes.
When:
2025
Mode:
Power BI Analysis
Dataset:
Student Performance
Focus:
Educational Analytics & Insights
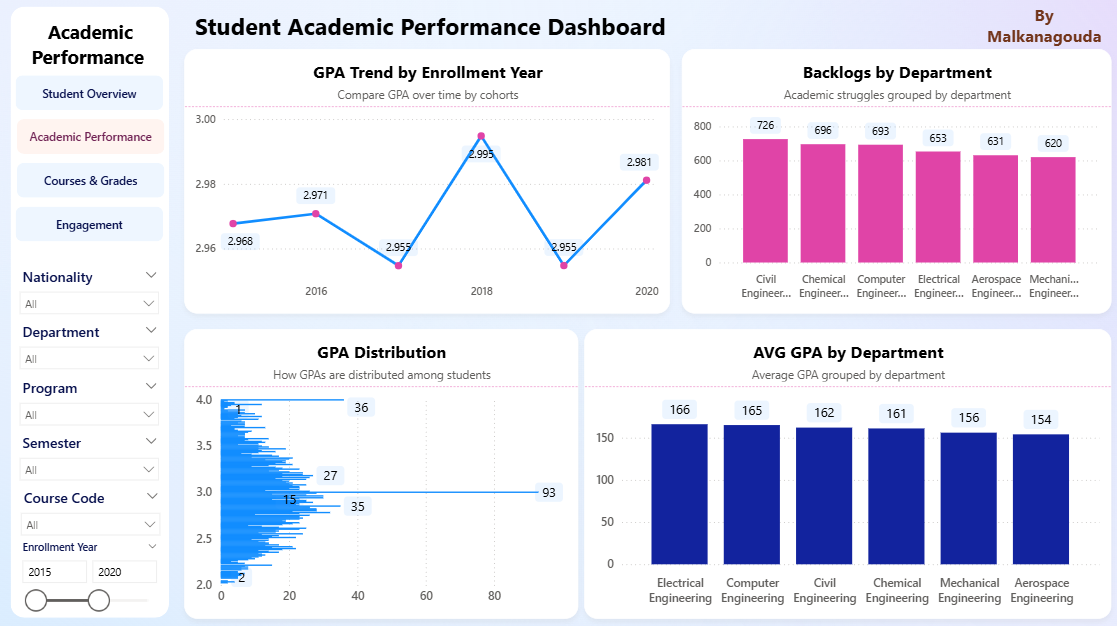
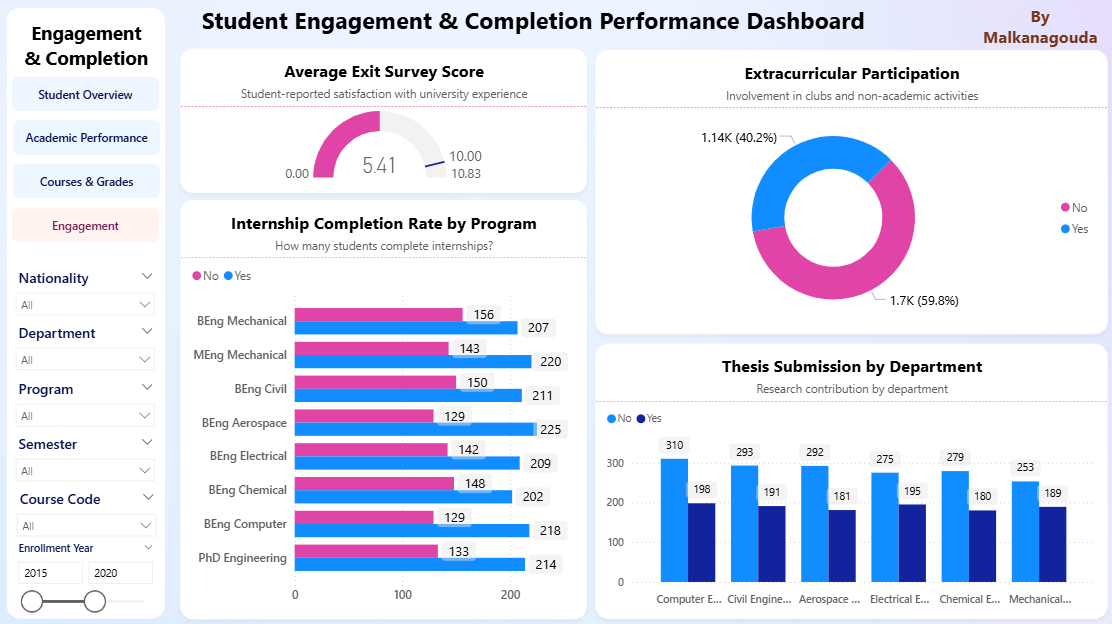
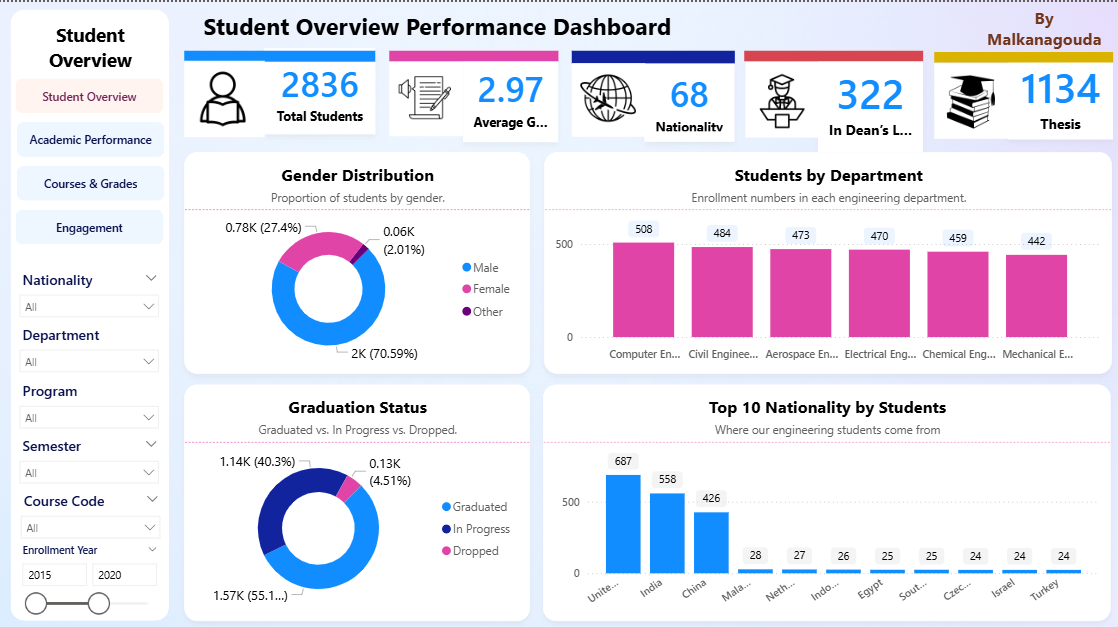
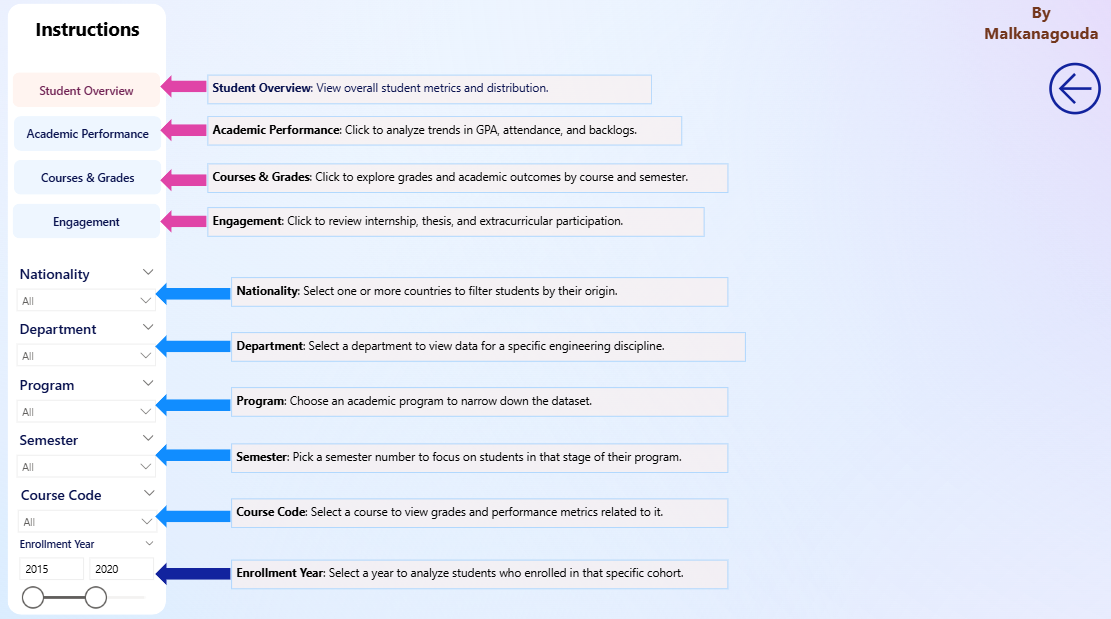
Project Snapshots

Business Impact
📊 Provides insights into student performance trends and subject-specific gaps.
💡 Highlights impact of test preparation and parental education on outcomes.
⚡ Supports educators in data-driven decision-making to improve academic performance.
Challenges & Learnings
⚡ Creating accurate DAX measures for complex performance metrics.
📊 Designing visualizations that clearly communicate insights and performance gaps.
🚀 Gained experience in educational analytics, DAX modeling, and interactive dashboard design.