RealEstate Dashboard – Surat
Real Estate Analytics & Investment Insights
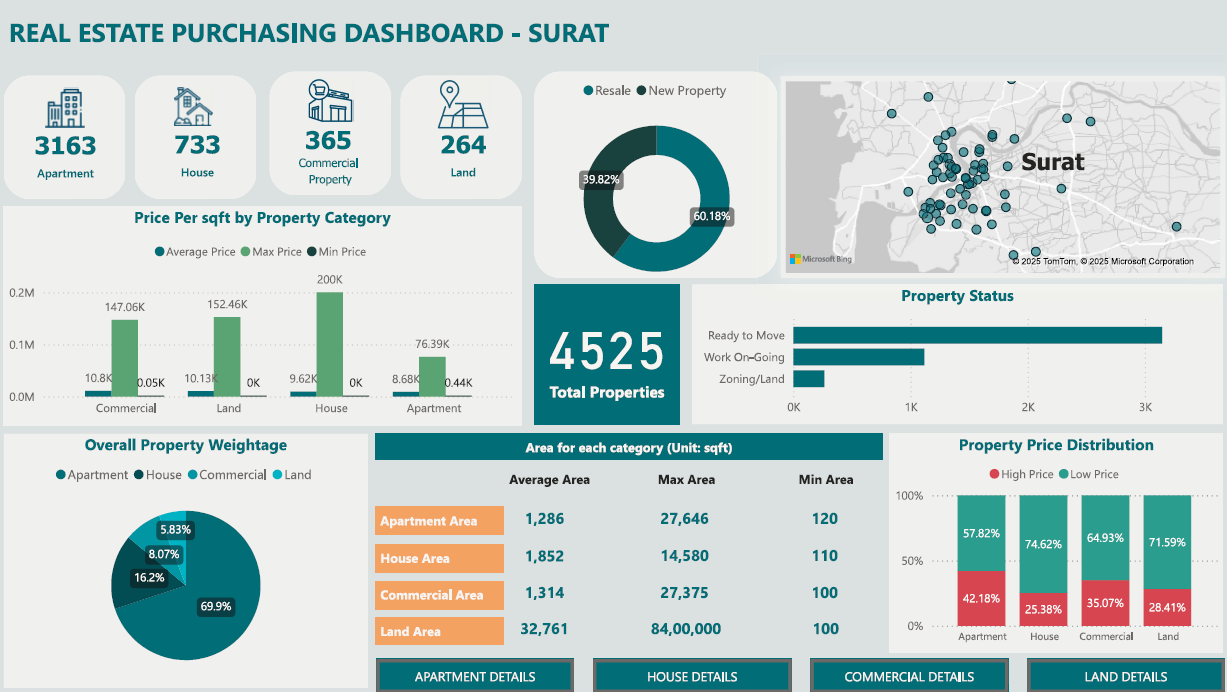
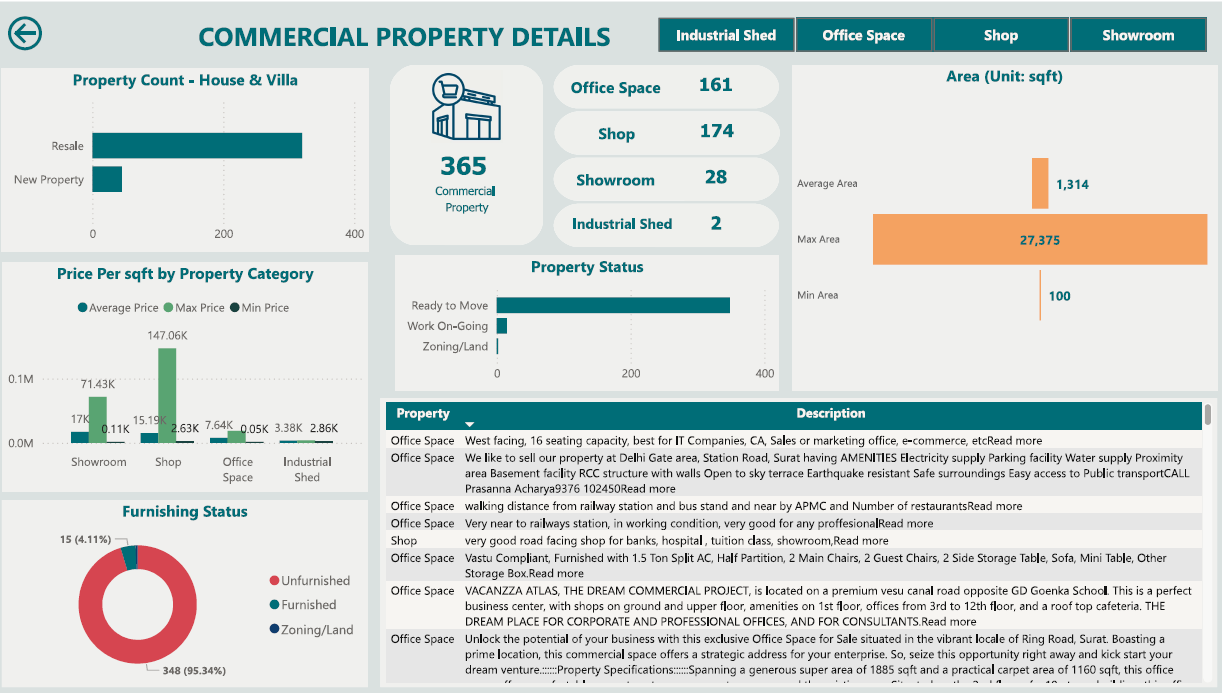
The RealEstate Dashboard – Surat provides an interactive analysis of Surat’s real estate market, offering insights into property listings, pricing trends, demand-supply patterns, and investment opportunities. The dashboard helps buyers, sellers, and analysts make informed decisions using Power BI.
Users can explore locality-wise listings, track price trends, analyze demand-supply patterns, and identify investment hotspots through interactive visuals and metrics.
Key Insights & Analytics
About the Project
Overview
This Power BI dashboard consolidates Surat real estate data to provide insights into listings, pricing, and market trends. Interactive visualizations allow users to explore demand-supply patterns, top localities, and investment opportunities in real time.
Visualization Suggestions
- 🗺️ Map Visualization: Show property distribution across Surat with price heatmaps.
- 📈 Line Chart: Track property price trends over time.
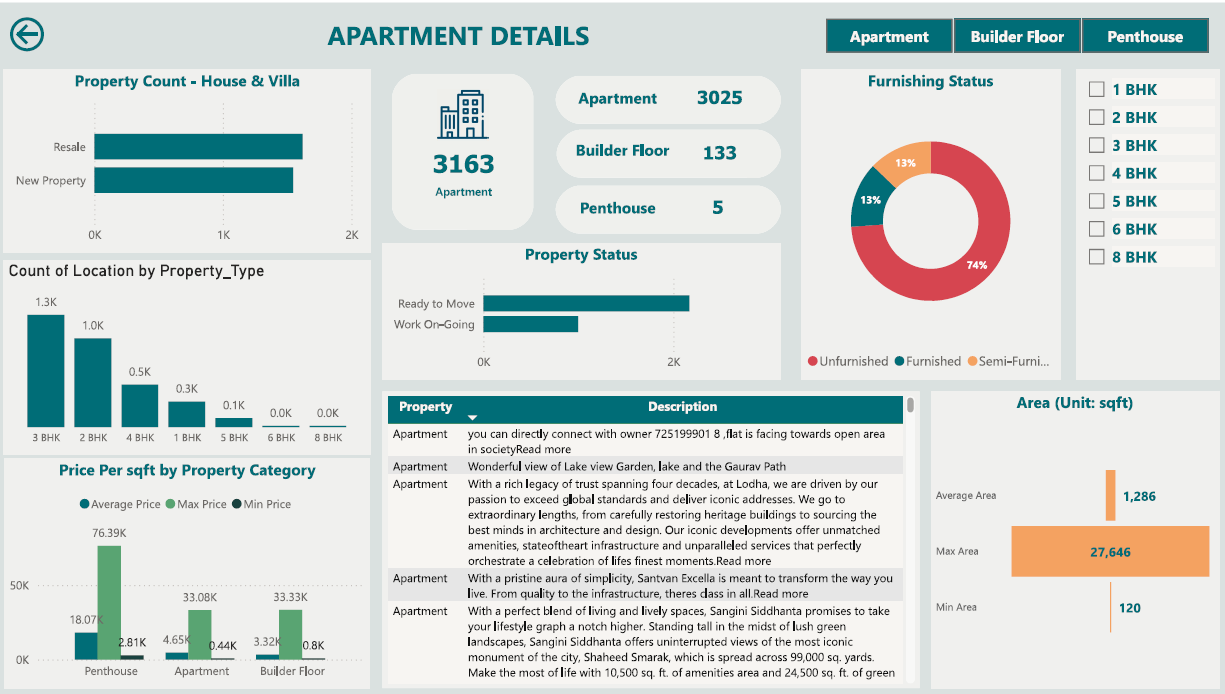
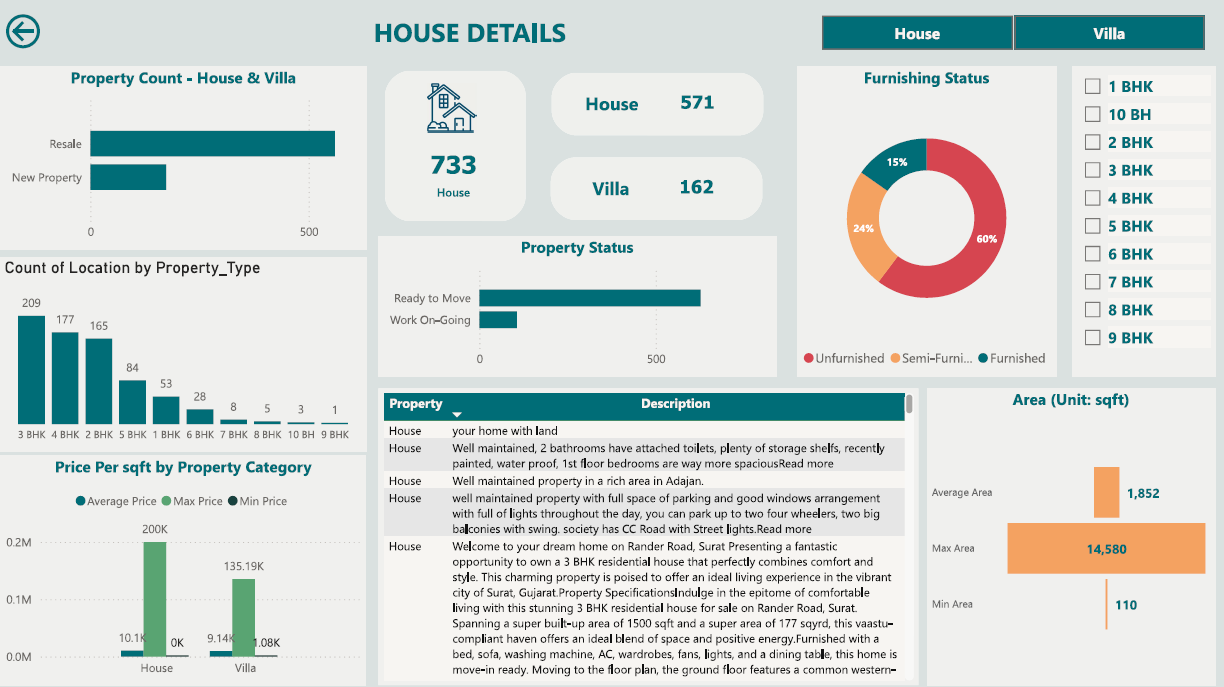
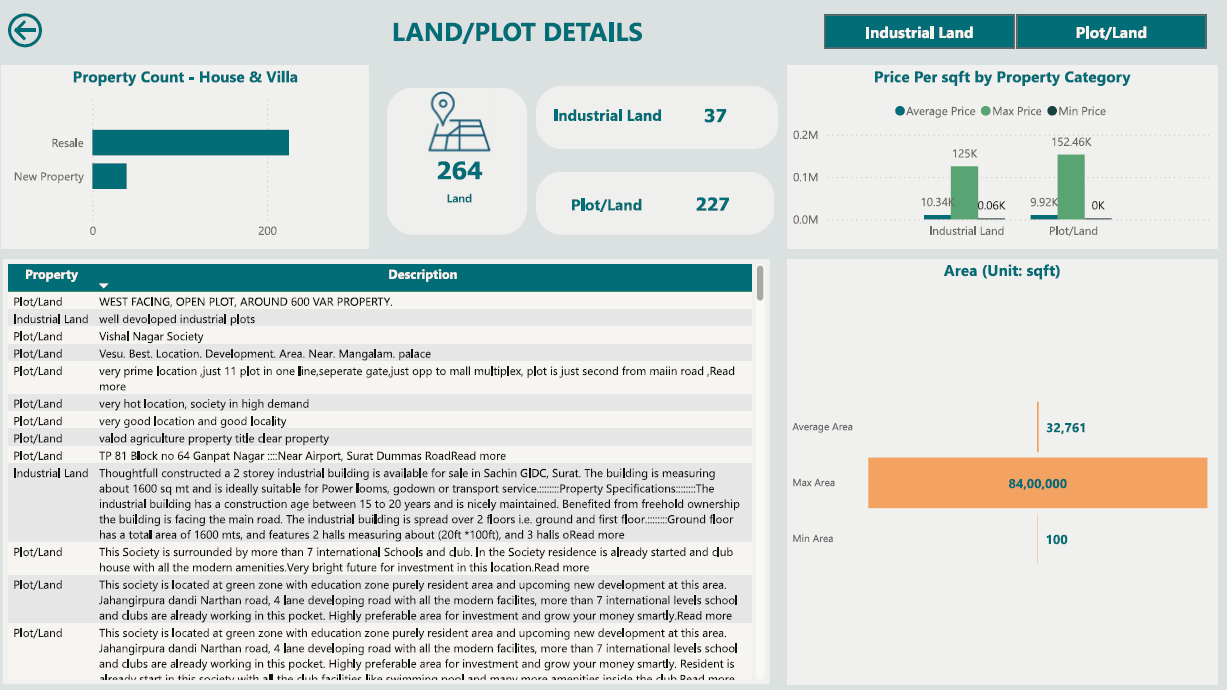
- 📊 Bar/Column Charts: Top localities by listings or average price.
- 🎛️ Slicers & Filters: Filter by property type, budget, locality, and date.
- 📌 Cards & KPIs: Display total listings, average price, and fastest-selling properties.
Outcomes
- Interactive dashboards for buyers, sellers, and real estate analysts.
- Enhanced understanding of property trends, top localities, and investment potential.
- Data-driven insights into demand-supply patterns and property pricing for strategic decisions.
When:
2025
Mode:
Power BI Analysis
Dataset:
Surat Real Estate Listings
Focus:
Property Market & Investment Analytics
Project Snapshots
Business Impact
📈 Identified top-performing localities and emerging investment zones in Surat.
💡 Provided insights on pricing trends and demand-supply gaps for buyers, sellers, and investors.
⚡ Enabled data-driven decisions in real estate investment and property sales strategies.
Challenges & Learnings
⚡ Cleaning and structuring property listing data for meaningful analysis.
📊 Designing interactive dashboards to clearly present pricing, demand, and investment insights.
🚀 Learned advanced Power BI techniques for mapping, KPIs, and real estate analytics.