🌎 World Population Analysis Dashboard
Data Visualization & Analytics Project
The World Population Analysis Dashboard offers dynamic insights into global population trends using interactive visualizations and analytical modeling in Power BI. This project explores demographic changes, regional disparities, age-wise distributions, and gender-based population comparisons across countries. It transforms massive global population datasets into visually engaging and actionable insights for researchers, policymakers, and analysts.
Project Highlights
About the Project
Overview
The World Population Analysis Dashboard provides a unified view of global population statistics by integrating data from multiple sources and time periods. It allows users to analyze population growth, gender distribution, and regional differences using Power BI’s interactive visuals. The project showcases the ability to handle massive datasets through efficient modeling and ETL processes.
Process & Data Modeling
- 📥 Extract: Data sourced from Excel files (1950–2100) and a text file mapping codes to countries and regions.
- 🧹 Transform: Cleaned, unpivoted, and structured data using Power Query Editor.
- 📊 Model: Designed a Star Schema with Dim Age, Dim Region, and Fact Population tables.
- ⚙️ Load: Imported refined data into Power BI for analysis and visualization.

Visualizations & Insights
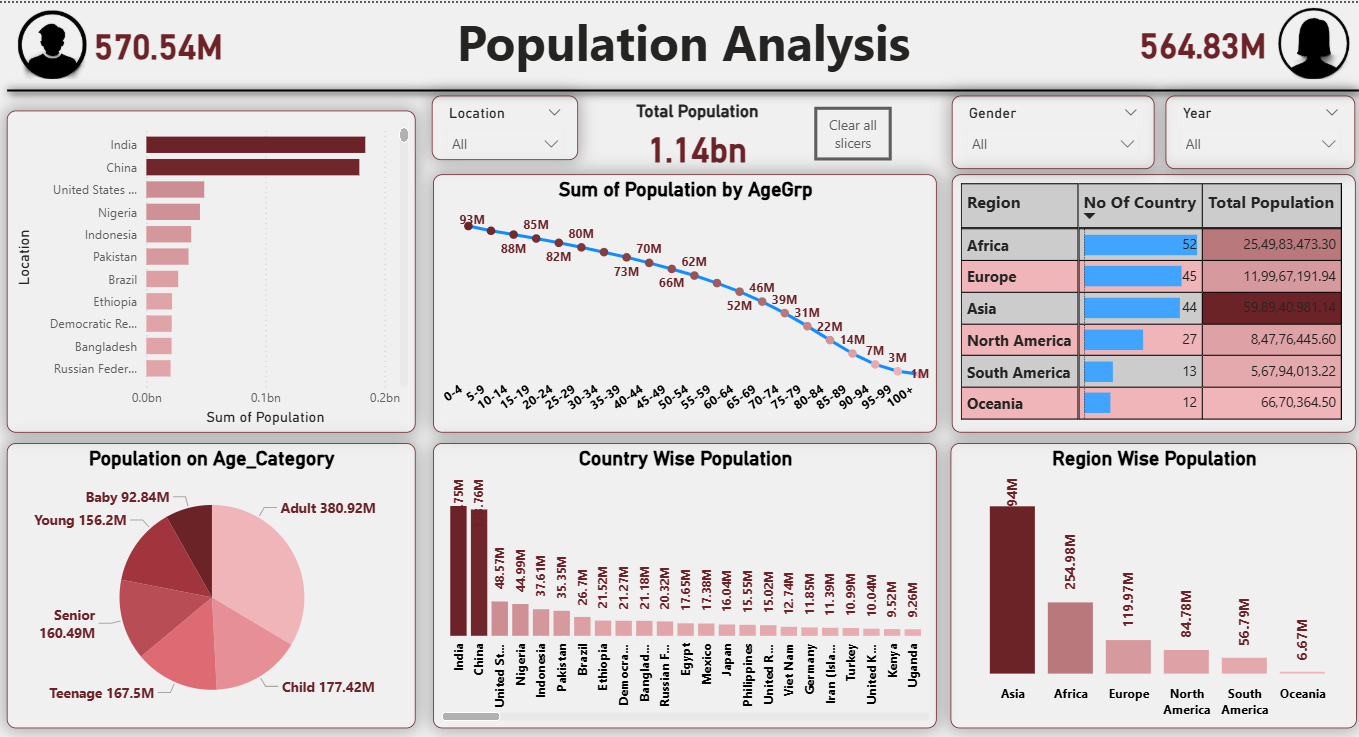
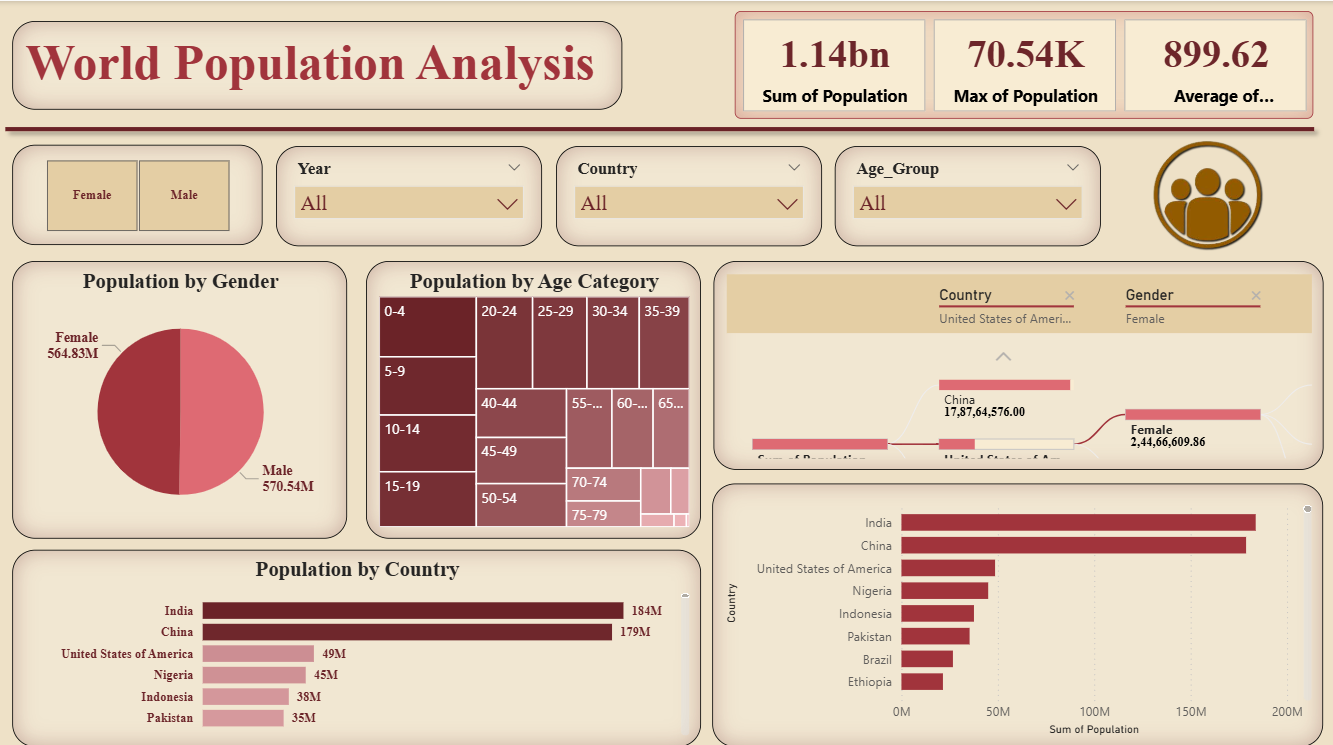
- 🌍 Map visuals display population of each country by year.
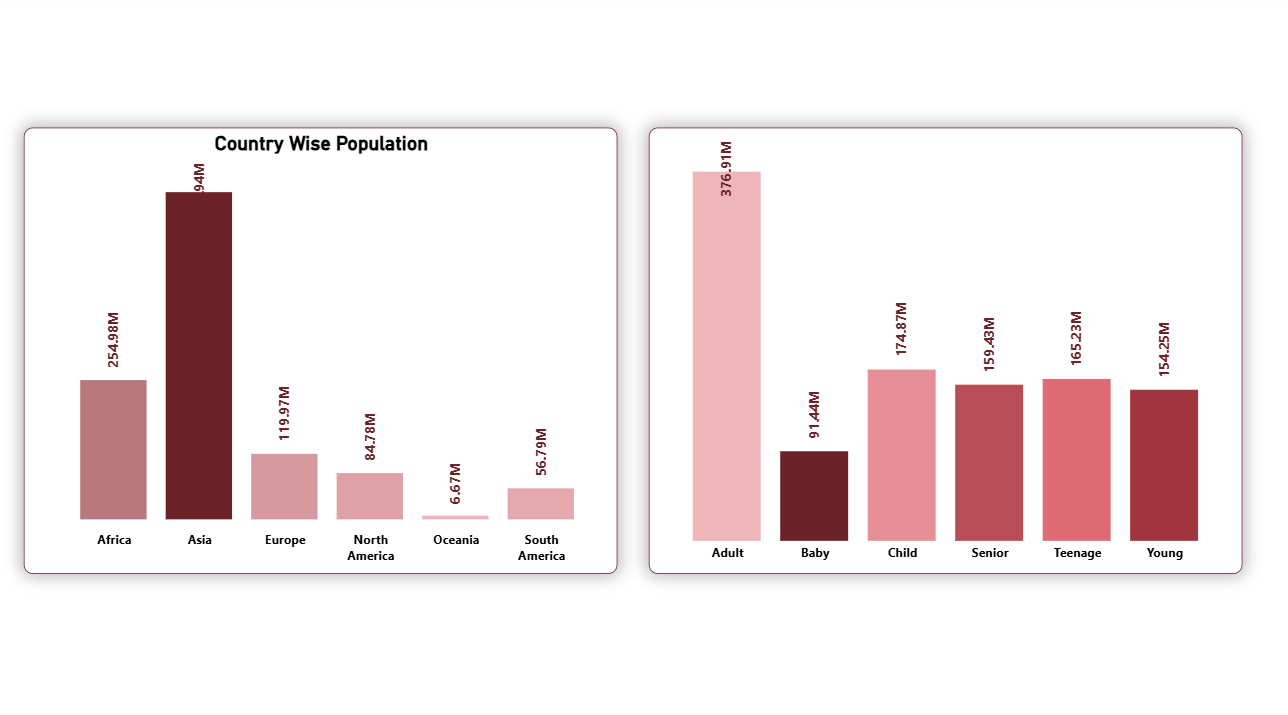
- 📊 Clustered bar and column charts highlight top populous countries and regional totals.
- 📈 Line charts reveal population growth by age group.
- 🧮 DAX measures compute male and female population totals and growth percentages.
- 🔎 Slicers and filters enable users to explore by country, region, and year interactively.
When:
2025
Mode:
Power BI Dashboard
Dataset:
Excel & Text Files (Global Population 1950–2100)
Focus:
Demographic & Population Analytics
Project Snapshots
Business Impact
📈 Enabled policymakers and demographers to monitor global population growth and disparities effectively.
🌍 Provided data-driven insights for regional development and demographic planning.
💡 Simplified understanding of large-scale population data through interactive Power BI storytelling.
Challenges & Learnings
⚙️ Managing and transforming large datasets (1950–2100) from multiple file formats efficiently.
🧩 Building accurate DAX measures for gender and age-wise analysis across decades.
🚀 Strengthened skills in Power Query, data modeling, and Power BI visual storytelling.