Nike Shoes Sales Analysis Dashboard
Retail Analytics Project
The Nike Shoes Sales Analysis Dashboard provides deep insights into Nike’s footwear sales performance across regions, product categories, and customer segments. Using Power BI, the project transforms raw sales data into meaningful visuals to help identify top-selling products, regional demand patterns, and profitability drivers. This report empowers business stakeholders to make data-driven decisions on product strategy, marketing, and inventory management.

Project Highlights
About the Project
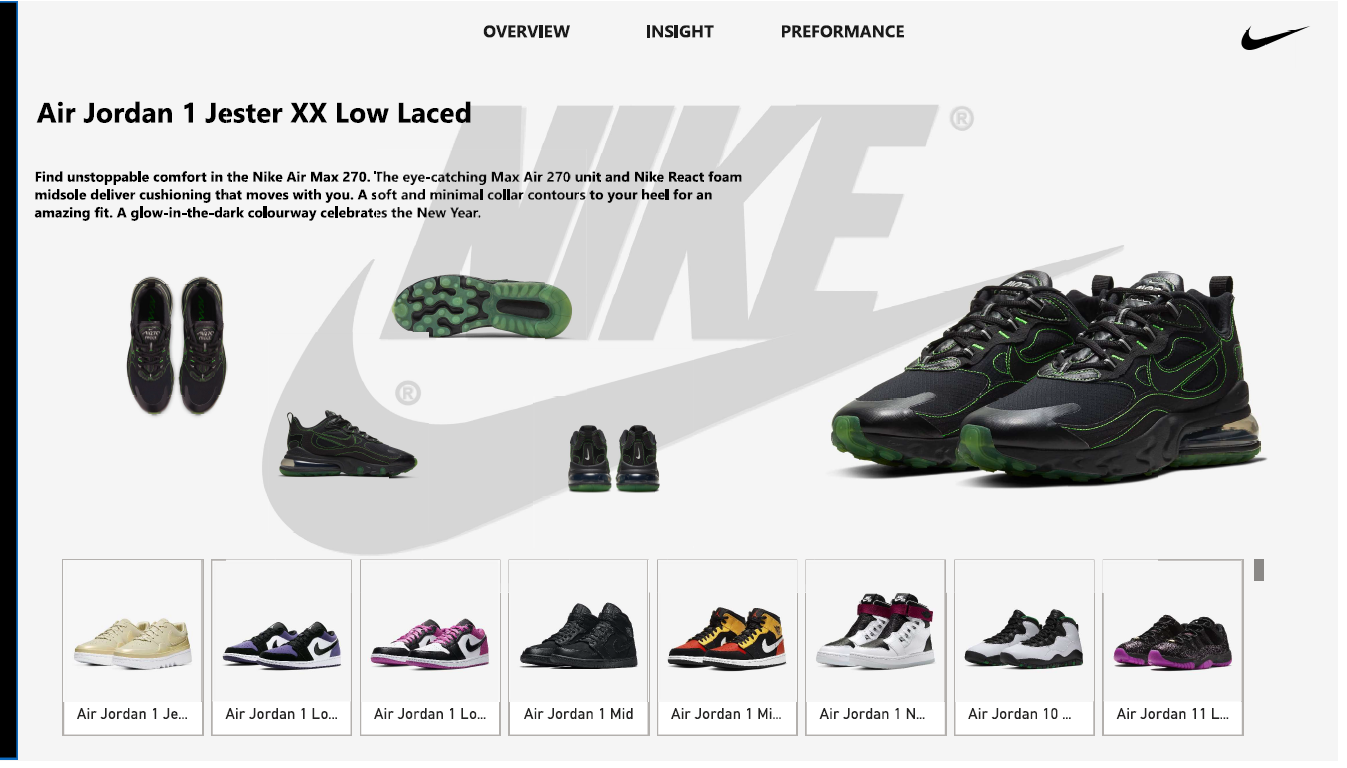
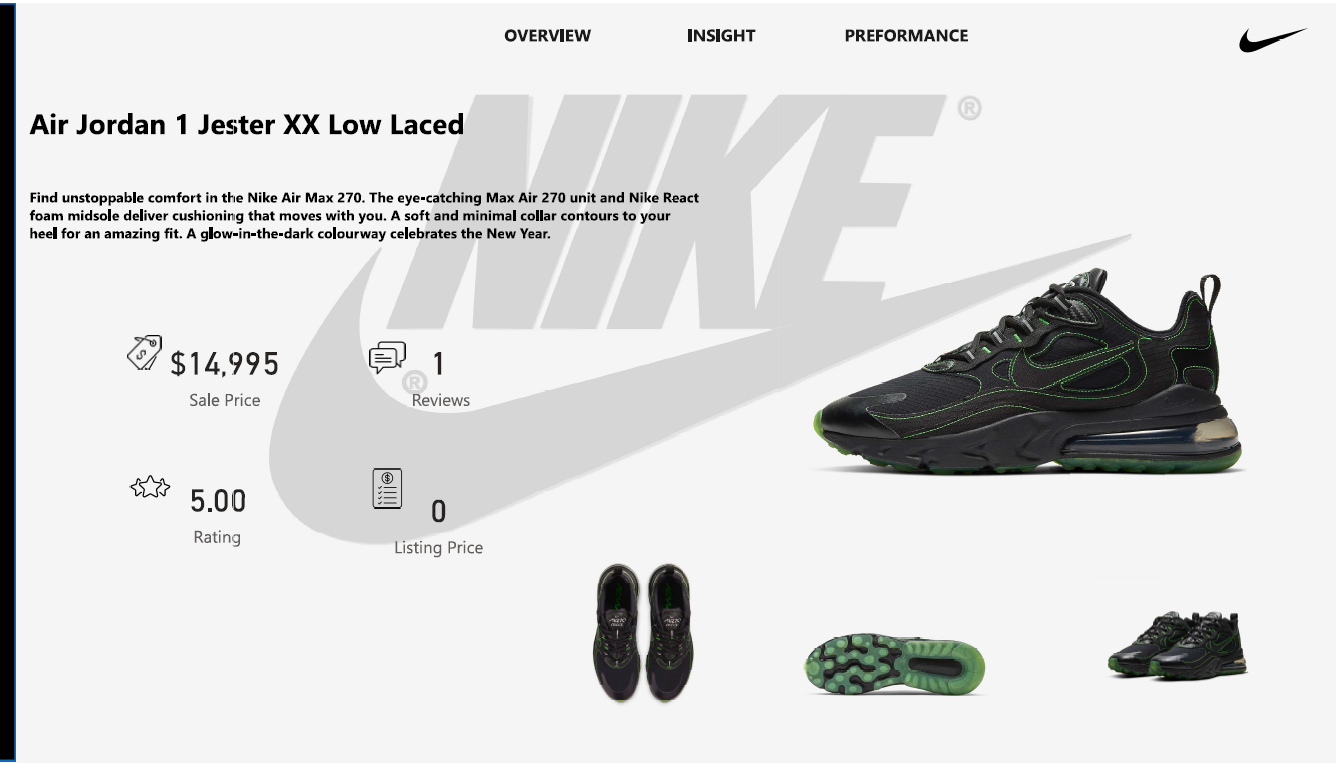
Overview
The Nike Shoes Sales Analysis dashboard showcases how data analytics can be used to drive retail success. It helps uncover top-performing products, key customer segments, and regional growth opportunities while optimizing sales and marketing strategies.
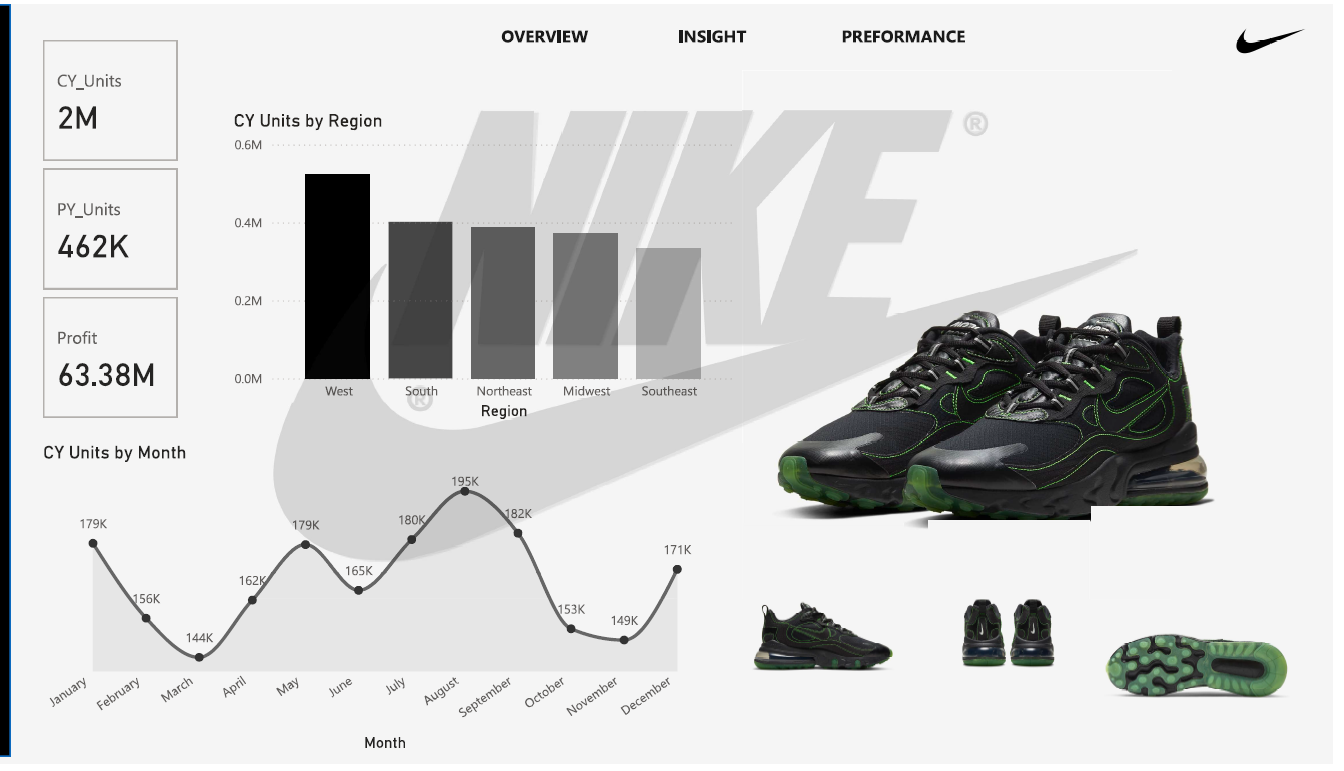
Key Insights
- 👟 Top-performing Nike shoe models and product categories
- 💰 Profit contribution by region and product line
- 📊 Seasonal sales patterns and growth trends
- 🗺️ Regional hotspots for marketing focus
- 🧍 Customer segmentation and loyalty metrics
Outcomes
- Enhanced visibility into product and regional performance.
- Improved decision-making for pricing, marketing, and inventory planning.
- Identified high-value customer groups for targeted campaigns.
When:
2024
Mode:
Power BI Dashboard
Dataset:
Nike Shoe Sales Data
Focus:
Retail & Sales Analytics
Project Snapshots
Business Impact
📈 Provided real-time visibility into sales and profitability across Nike’s product range.
💡 Helped optimize marketing and promotional strategies for different regions.
📦 Enabled smarter inventory management and restocking decisions based on demand patterns.
Challenges & Learnings
⚡ Data cleaning and modeling to ensure accuracy across product categories and time periods.
📊 Designing a visually appealing yet functional dashboard for multiple stakeholder needs.
🚀 Gained deeper expertise in DAX, Power Query, and data storytelling for retail analytics.