Medicine Sales Analysis
Business Analytics Project
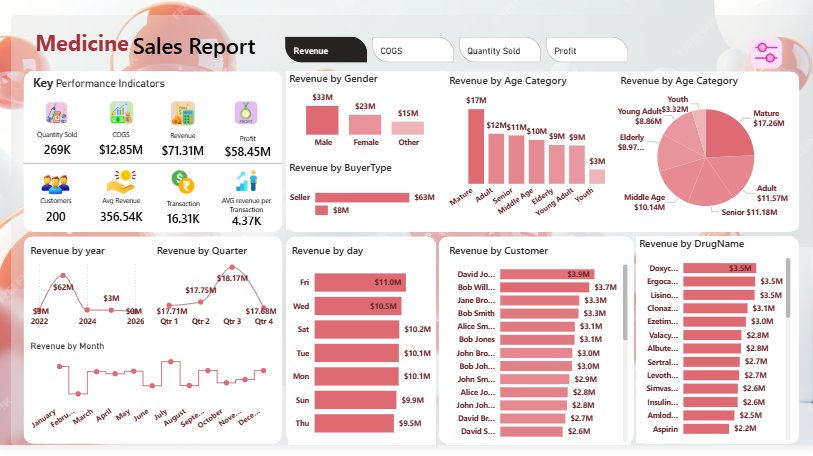
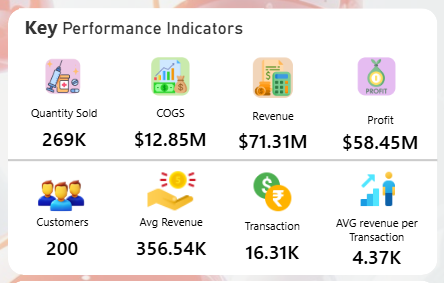
The Medicine Sales Analysis project focuses on analyzing pharmaceutical sales data to uncover customer purchasing patterns, sales performance, and pharmacy trends. Using Power BI, the project transforms raw sales data into interactive dashboards, enabling businesses to track KPIs such as order volume, revenue, popular medicines, and stock availability.
Project Highlights
About the Project
Overview
This Medicine Sales Analysis project demonstrates how Power BI can transform raw pharmacy sales data into actionable insights. The solution helps pharmacies track sales KPIs, customer behavior, and inventory efficiency in real-time.
Key Insights
- 💊 Most sold medicines and categories
- 📊 Monthly revenue trends & peak purchasing hours
- 📦 Stock availability and inventory alerts
- ⭐ Pharmacy ratings vs sales volume
- 👥 Customer segmentation by purchase frequency & spending
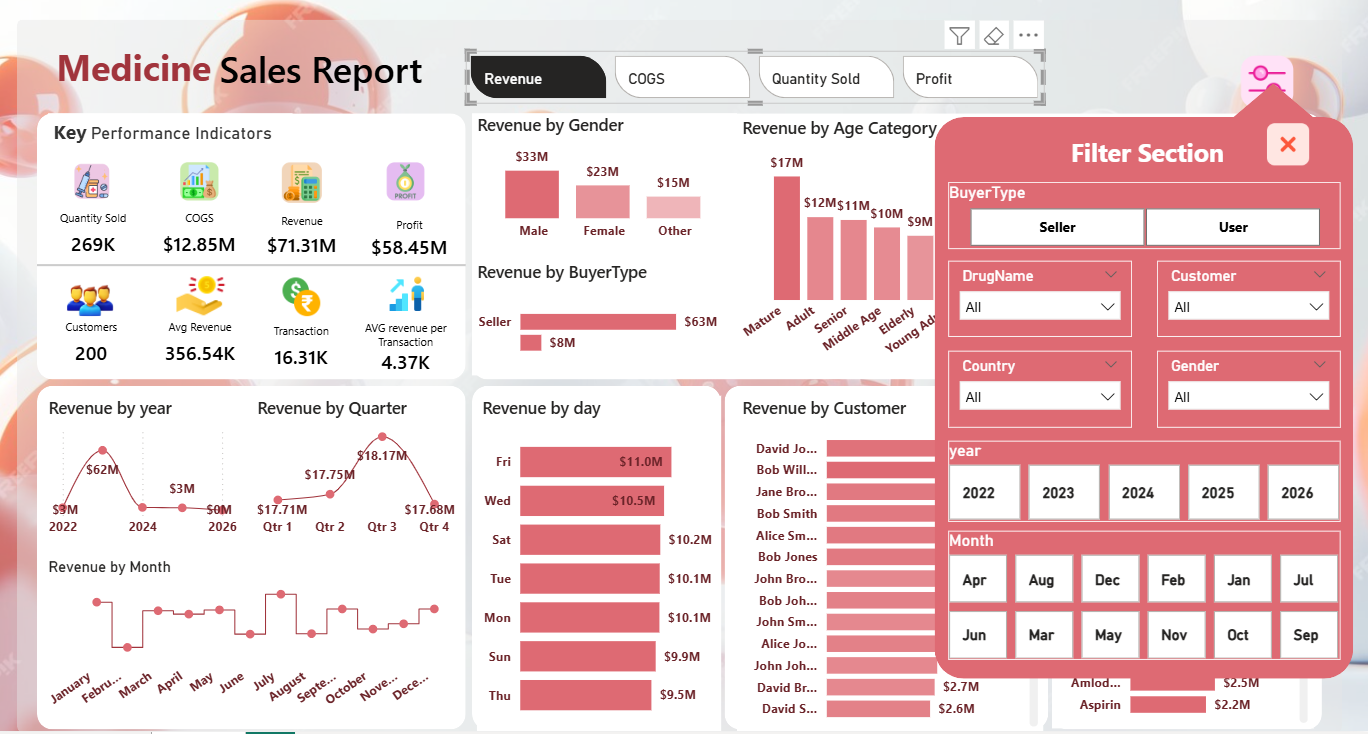
The dashboards help pharmacy managers and operations teams make data-driven decisions to improve sales, manage stock efficiently, and enhance customer satisfaction.
Outcomes
- Interactive dashboards for pharmacy decision-making
- Improved customer experience insights
- Optimized inventory management and sales operations
By the end, the project showcased how data analytics can boost pharmacy sales performance and enhance profitability.
When:
2024
Mode:
Power BI Dashboard
Dataset:
Pharmacy Sales Data
Focus:
Business Analytics
Project Snapshots

Business Impact
📈 Helped pharmacies identify peak purchase times and optimize staff and inventory operations.
💡 Improved customer satisfaction by ensuring medicine availability and reducing wait times.
💰 Increased overall sales revenue by highlighting high-demand medicines and top-performing pharmacies.
Challenges & Learnings
⚡ Cleaning and preparing raw sales data with missing and inconsistent values.
📊 Designing dashboards that balance visual appeal, clarity, and real-time performance.
🚀 Learned the importance of building scalable data models and dashboards for actionable insights.