🗳️ Live Election Results Dashboard
Data Visualization Project
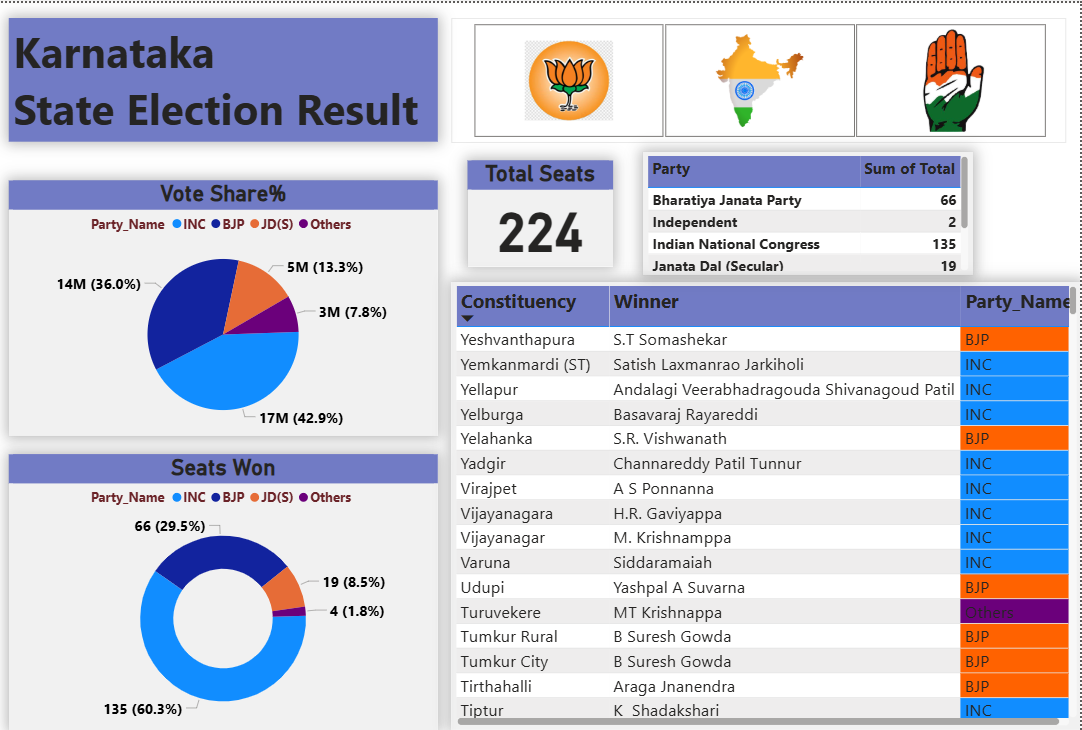
The Live Election Results Dashboard provides a real-time, interactive visualization of election outcomes across states and constituencies. Built using Power BI, it enables users to monitor party performance, track constituency-level winners, and analyze voting trends effectively. The project converts complex election datasets into engaging and insightful analytics for journalists, analysts, and citizens.
Project Highlights
About the Project
Overview
The Live Election Results Dashboard transforms election data into a visually engaging, real-time analytics solution. It enables users to track party performance, view vote share distributions, and analyze results at both the state and constituency levels. This project demonstrates how Power BI can enhance political transparency through interactive reporting.
Key Insights
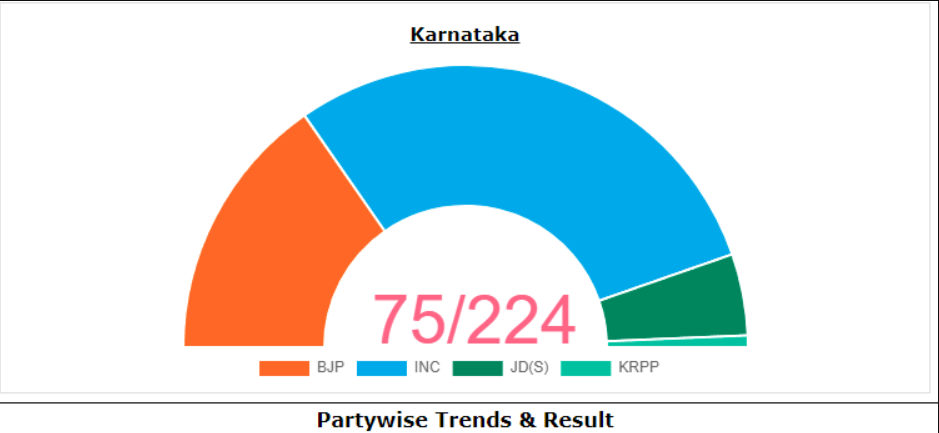
- 📍 Real-time tracking of election results and party performance
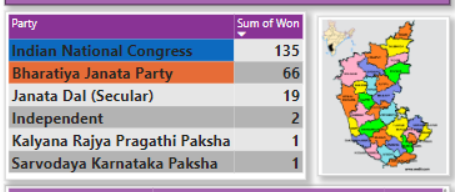
- 📊 Seat distribution and vote share comparison by party
- 🗺️ Map visualization showing constituency-level dominance
- 📈 Trends analysis highlighting swing regions and growth patterns
- 🔄 Drill-through navigation from state to constituency view
Outcomes
- Provided transparent, easy-to-understand election insights for the public.
- Enhanced decision-making for analysts and political parties through visual data exploration.
- Demonstrated how real-time data can improve media reporting and public engagement.
When:
2025
Mode:
Power BI Dashboard
Dataset:
Election Commission of India, Hindustan Times
Focus:
Political & Public Data Analytics
Project Snapshots
Business Impact
📰 Improved transparency and engagement in live election reporting.
🎯 Empowered political strategists and journalists with actionable, data-driven insights.
🌍 Enhanced real-time visualization of nationwide election data for public understanding.
Challenges & Learnings
⚡ Integrating and cleaning large, real-time datasets from multiple public sources.
📊 Creating a map-based visualization that remained fast and responsive with live updates.
🚀 Strengthened expertise in Power Query, DAX measures, and dynamic storytelling through data.