🏨 Hotel Bookings Analysis Dashboard
Data Analytics & Business Intelligence Project
The Hotel Bookings Analysis Dashboard provides a detailed overview of hotel performance, booking trends, revenue generation, and customer behavior. Built using Power BI, this project transforms raw booking data from multiple sources into meaningful insights that empower hotel managers to make data-driven decisions for improving occupancy, optimizing pricing, and enhancing customer experience.
Project Highlights
About the Project
Overview
The Hotel Bookings Analysis Dashboard is designed to help hospitality professionals analyze and optimize their booking operations. Using data from five CSV files—covering hotels, rooms, dates, and booking transactions—the dashboard provides a complete view of business performance and customer engagement.
Key Insights
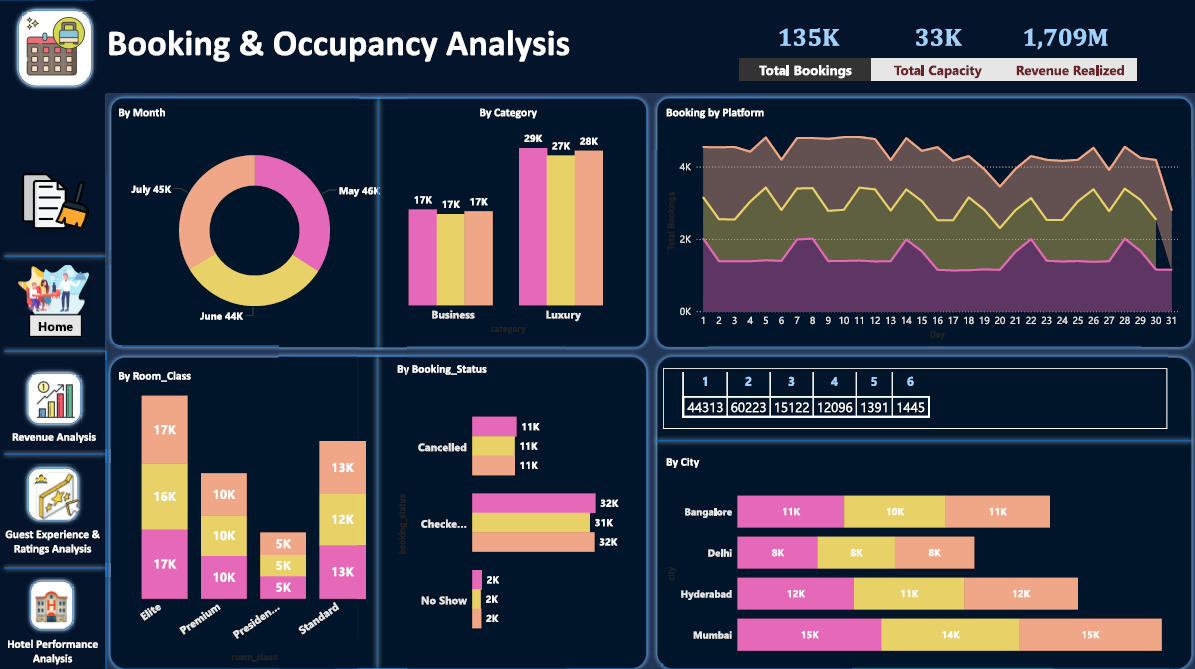
- 📅 Identified booking trends by day, week, and month
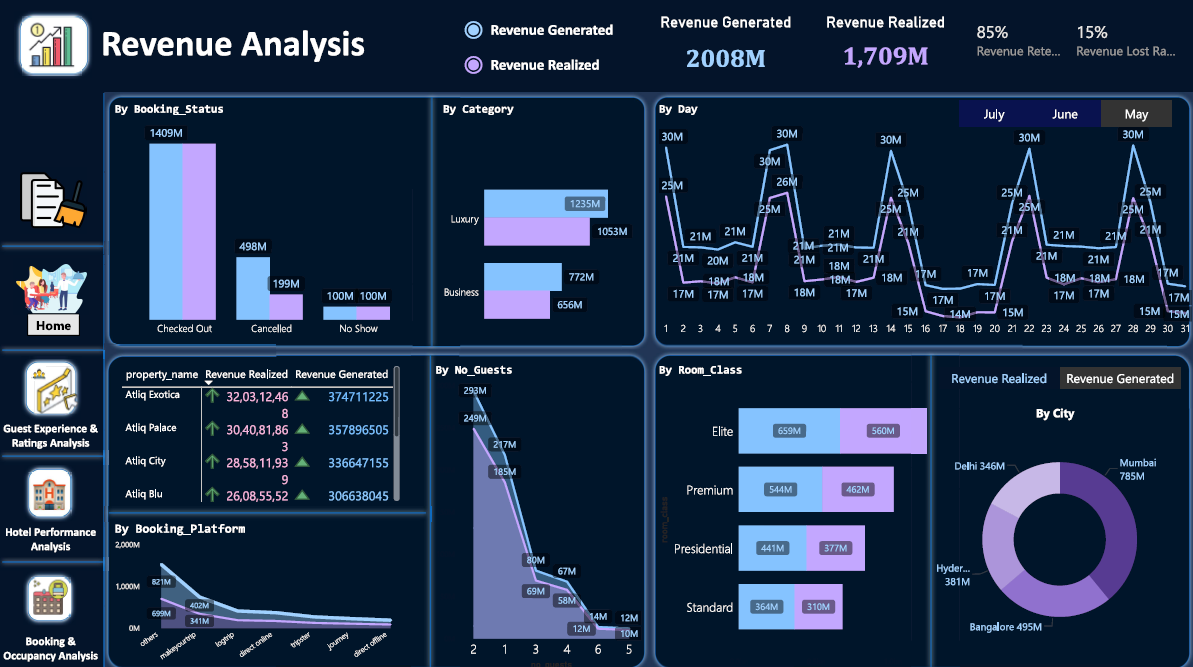
- 💰 Analyzed total and realized revenue by hotel and room type
- 🏨 Measured occupancy rates and capacity utilization
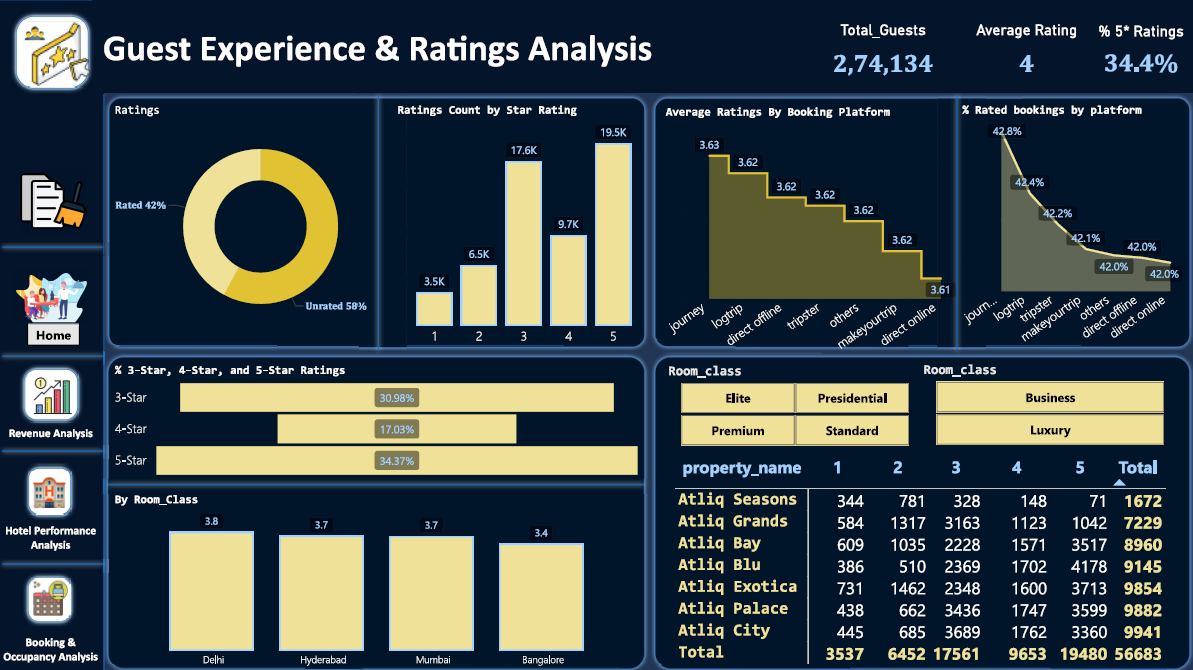
- ⭐ Tracked customer ratings and booking source preferences
- 🚫 Investigated cancellation and no-show trends
Outcomes
- Improved visibility into hotel performance and guest behavior.
- Enabled data-driven pricing and capacity management decisions.
- Optimized marketing and operational strategies based on insights.
When:
2025
Mode:
Power BI Dashboard
Dataset:
Hotel & Booking Data (5 CSV Files)
Focus:
Hospitality & Revenue Analytics
Project Snapshots
Business Impact
📊 Provided real-time visibility into booking performance and occupancy rates.
💡 Enabled data-driven decision-making for pricing, promotions, and capacity planning.
🏆 Improved customer satisfaction and revenue management through data insights.
Challenges & Learnings
⚙️ Complex data modeling across five CSV files with multiple relationships.
📈 Designing KPIs for occupancy, cancellations, and realized revenue using DAX.
🚀 Strengthened skills in Power Query, data modeling, and storytelling for hospitality analytics.