👥 HR Analytics Dashboard
Data Analytics & Business Intelligence Project
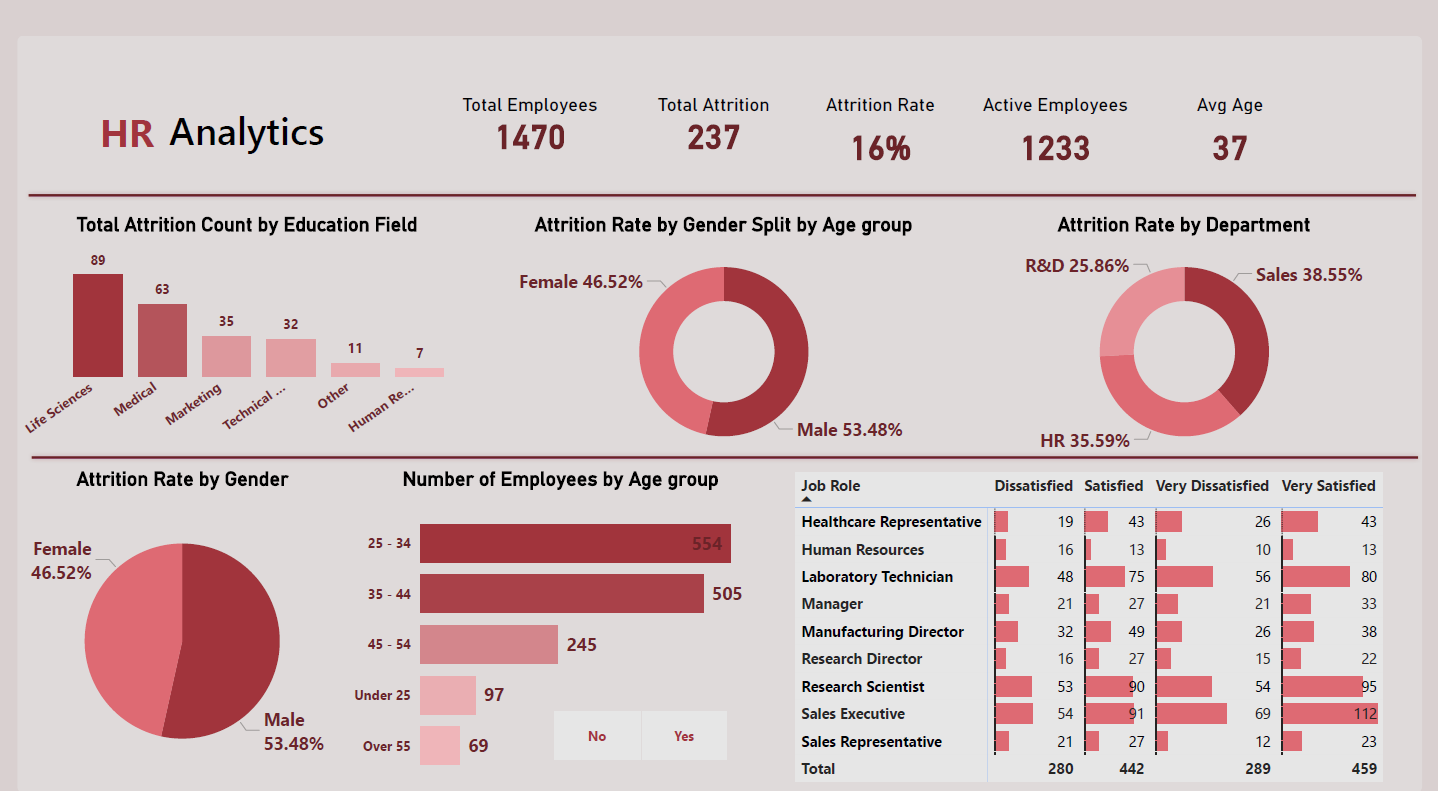
The HR Analytics Dashboard provides a comprehensive overview of workforce data, enabling organizations to track employee demographics, monitor attrition rates, analyze compensation structures, and assess performance trends. Developed using Power BI, it transforms HR data into interactive visualizations that support informed decision-making in recruitment, retention, and workforce management.
Project Highlights
About the Project
Overview
The HR Analytics Dashboard transforms employee and HR data into actionable insights. It helps organizations monitor workforce demographics, track recruitment trends, assess performance, and manage employee retention. The dashboard integrates data from multiple HR systems and visualizes key HR metrics through interactive visuals and KPIs.
Key Insights
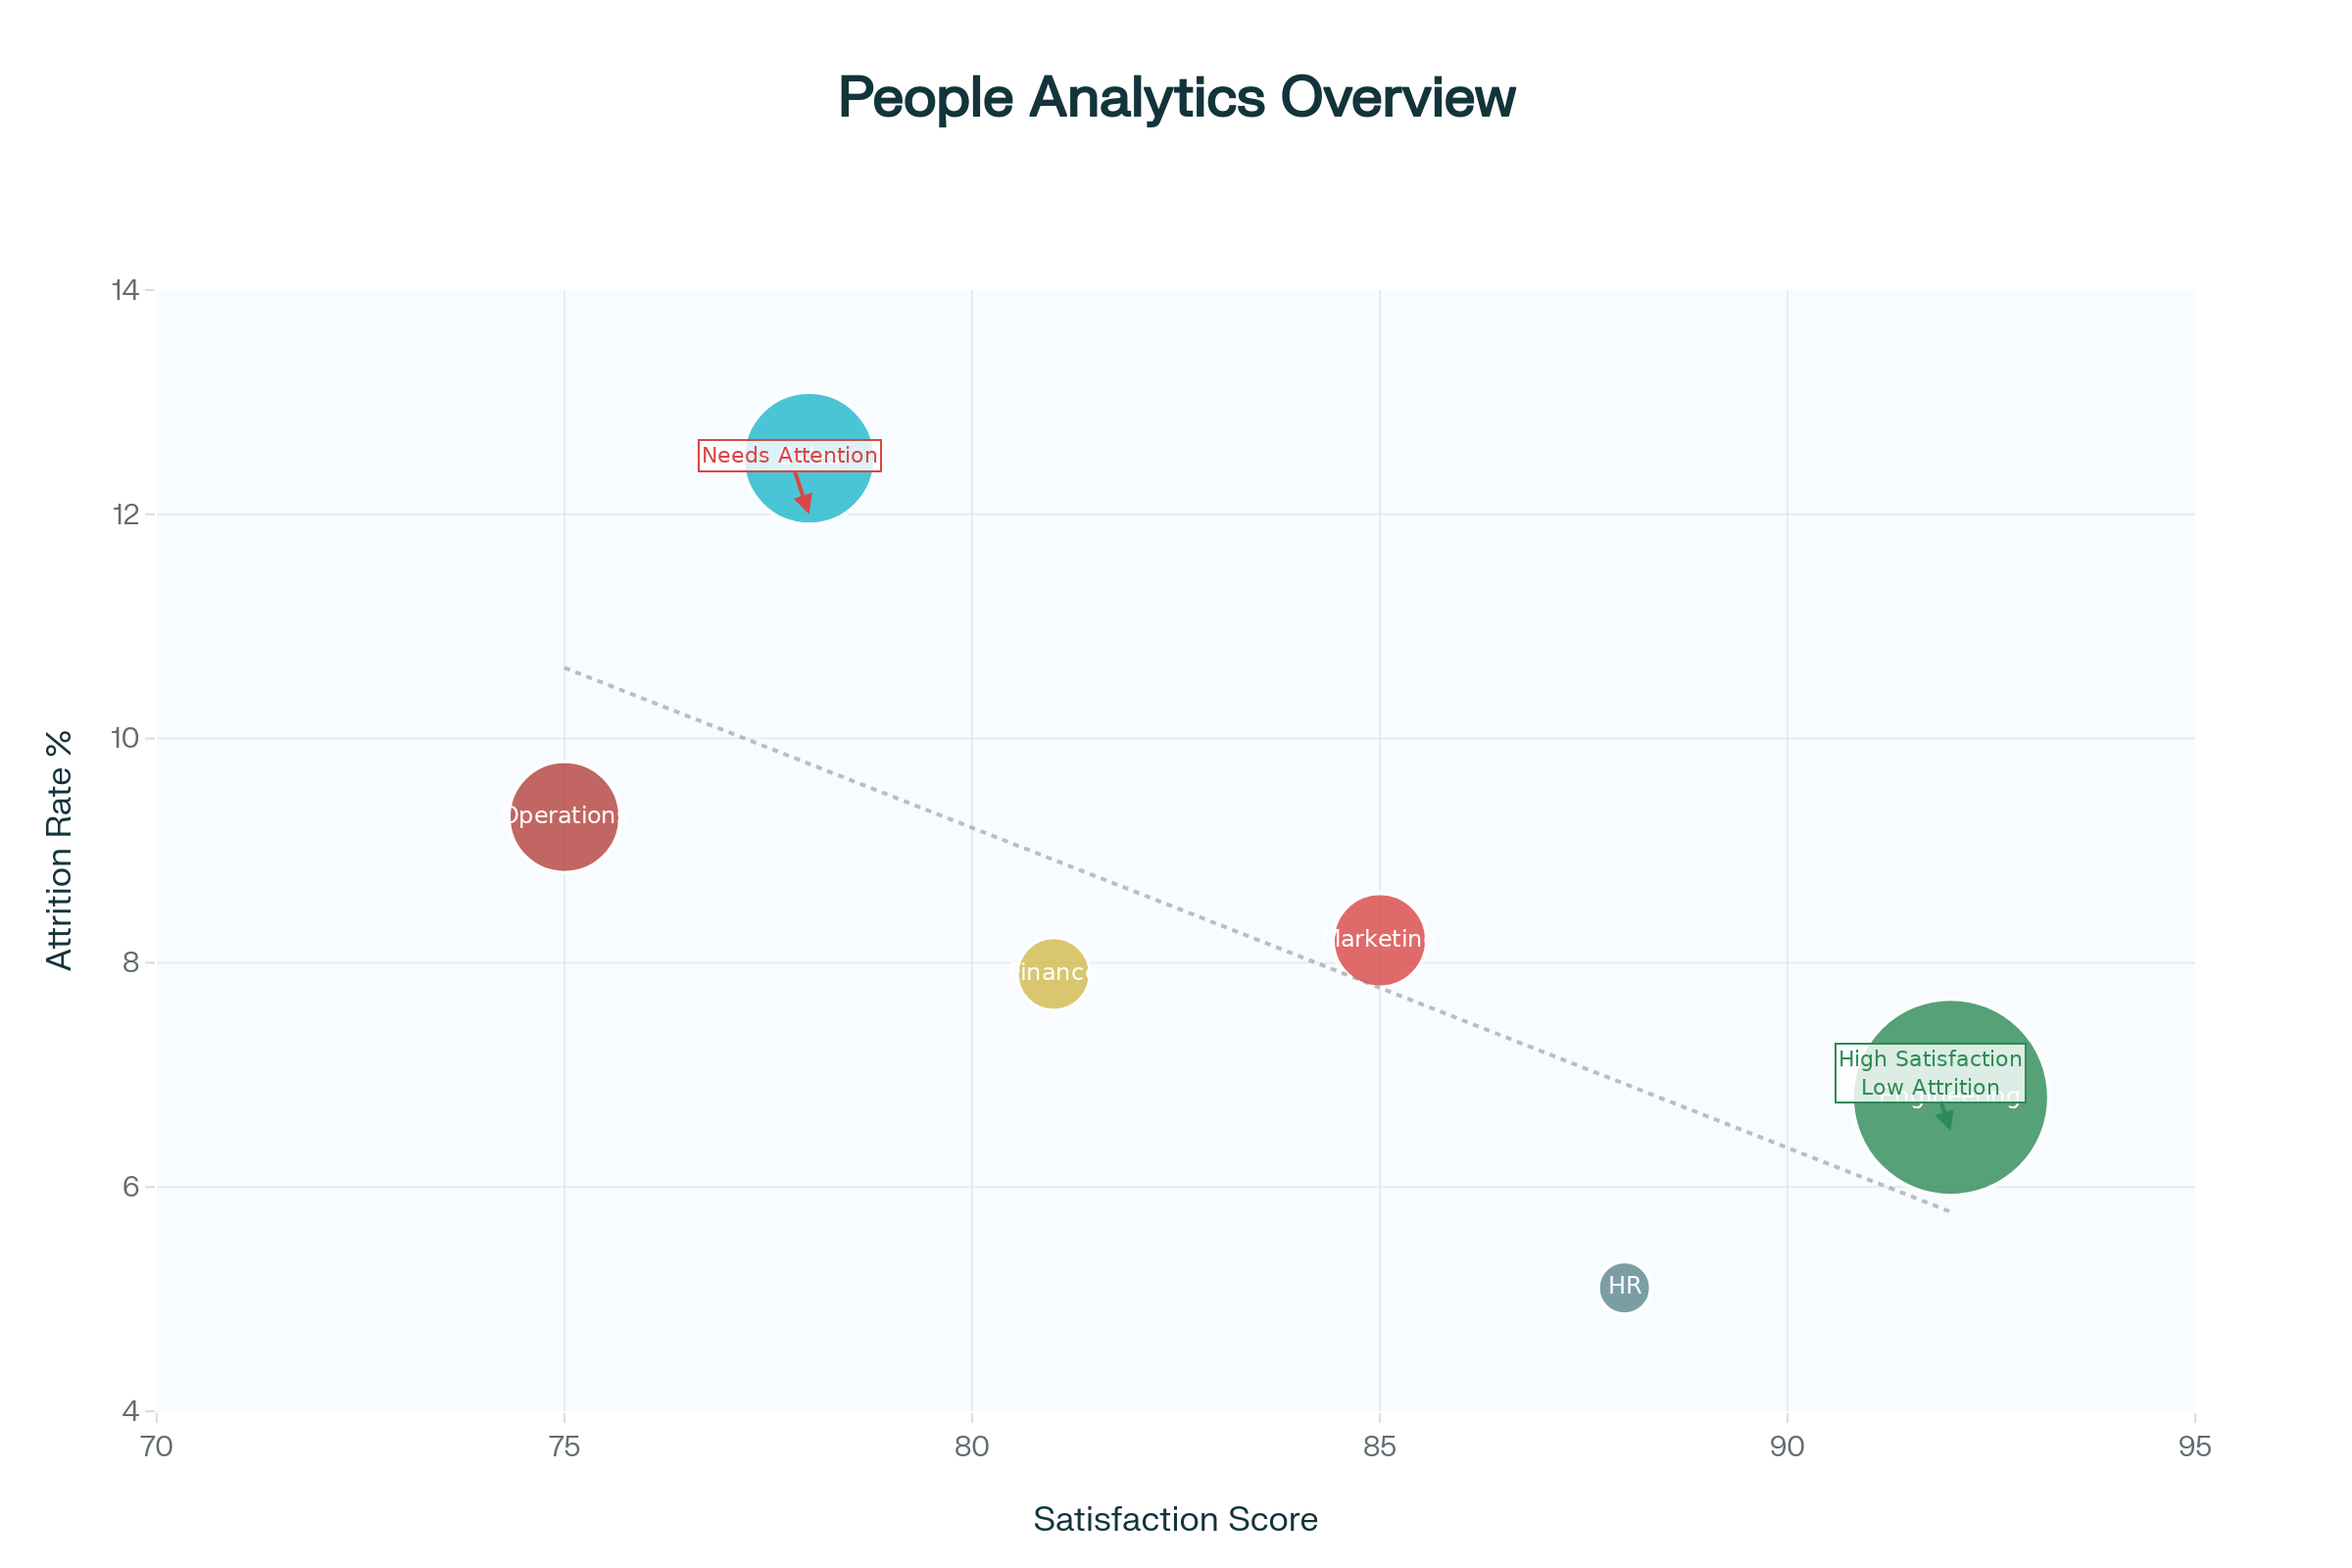
- 👥 Workforce demographics by age, gender, and department.
- 📈 Recruitment and attrition rate trends across divisions.
- 💼 Salary and compensation analysis by role and experience.
- 🏅 Employee performance and productivity measures.
- 🎓 Training participation and career development tracking.
Outcomes
- Enhanced workforce visibility for HR leadership and management.
- Data-driven insights to optimize recruitment and retention strategies.
- Improved employee engagement and talent development initiatives.
When:
2025
Mode:
Power BI Dashboard
Dataset:
Employee & HR Data (CSV / Excel Files)
Focus:
Human Resources & Workforce Analytics
Project Snapshots
Business Impact
📊 Provided real-time workforce insights for better HR decision-making.
💡 Helped identify departments with high attrition and improve retention plans.
🏆 Supported equitable compensation analysis and employee development programs.
Challenges & Learnings
⚙️ Managing large employee datasets and ensuring data accuracy across sources.
📈 Creating dynamic DAX measures for attrition, performance, and salary analytics.
🚀 Strengthened Power BI skills in HR data storytelling, KPIs, and visualization techniques.