Global GDP Data Analysis
Economics & Business Analytics Project
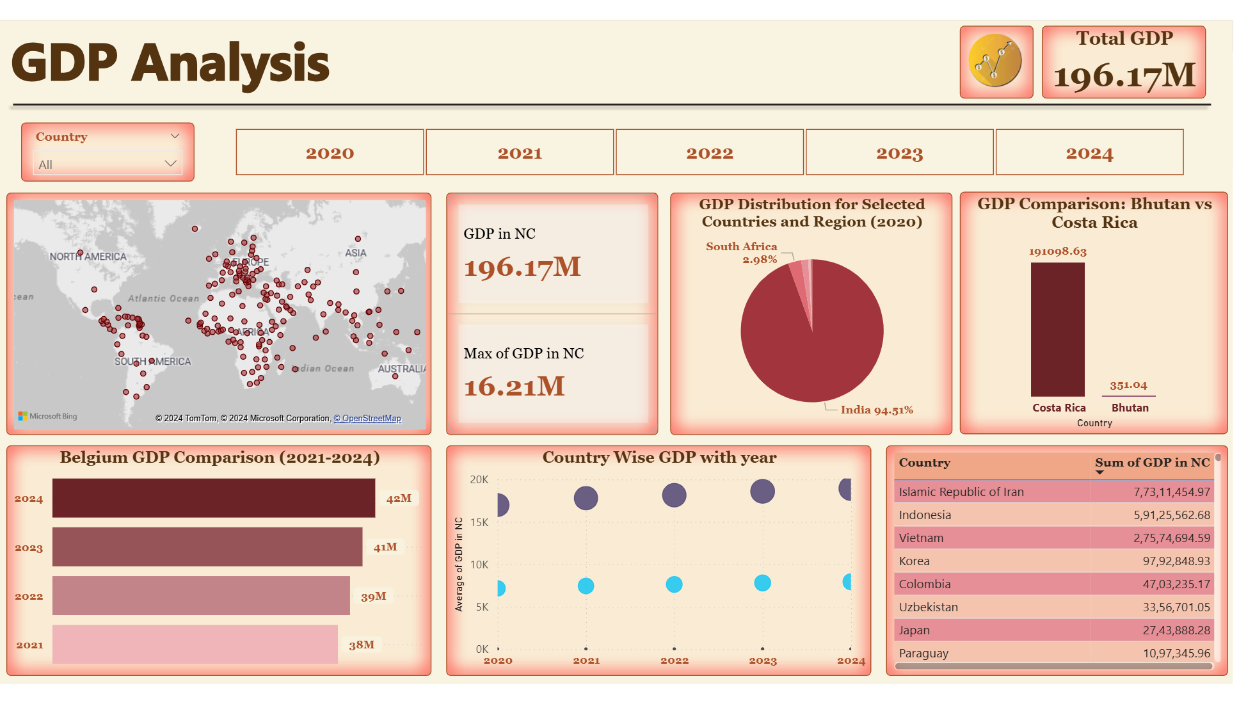
The Global GDP Data Analysis project explores country-level GDP data across multiple years, including population, GDP growth, per capita income, and sector-wise contributions. Using Python and Power BI, this project transforms raw economic data into actionable insights, helping understand economic performance, trends, and global development patterns. The analysis provides a glimpse into how policymakers and economists track and compare countries' economic health.
Project Highlights
About the Project
Overview
This Global GDP Data Analysis project demonstrates how data analytics can uncover insights about countries' economic performance, growth patterns, and sectoral contributions. The solution helps economists, policymakers, and investors make informed decisions based on historical and projected trends.
Key Insights
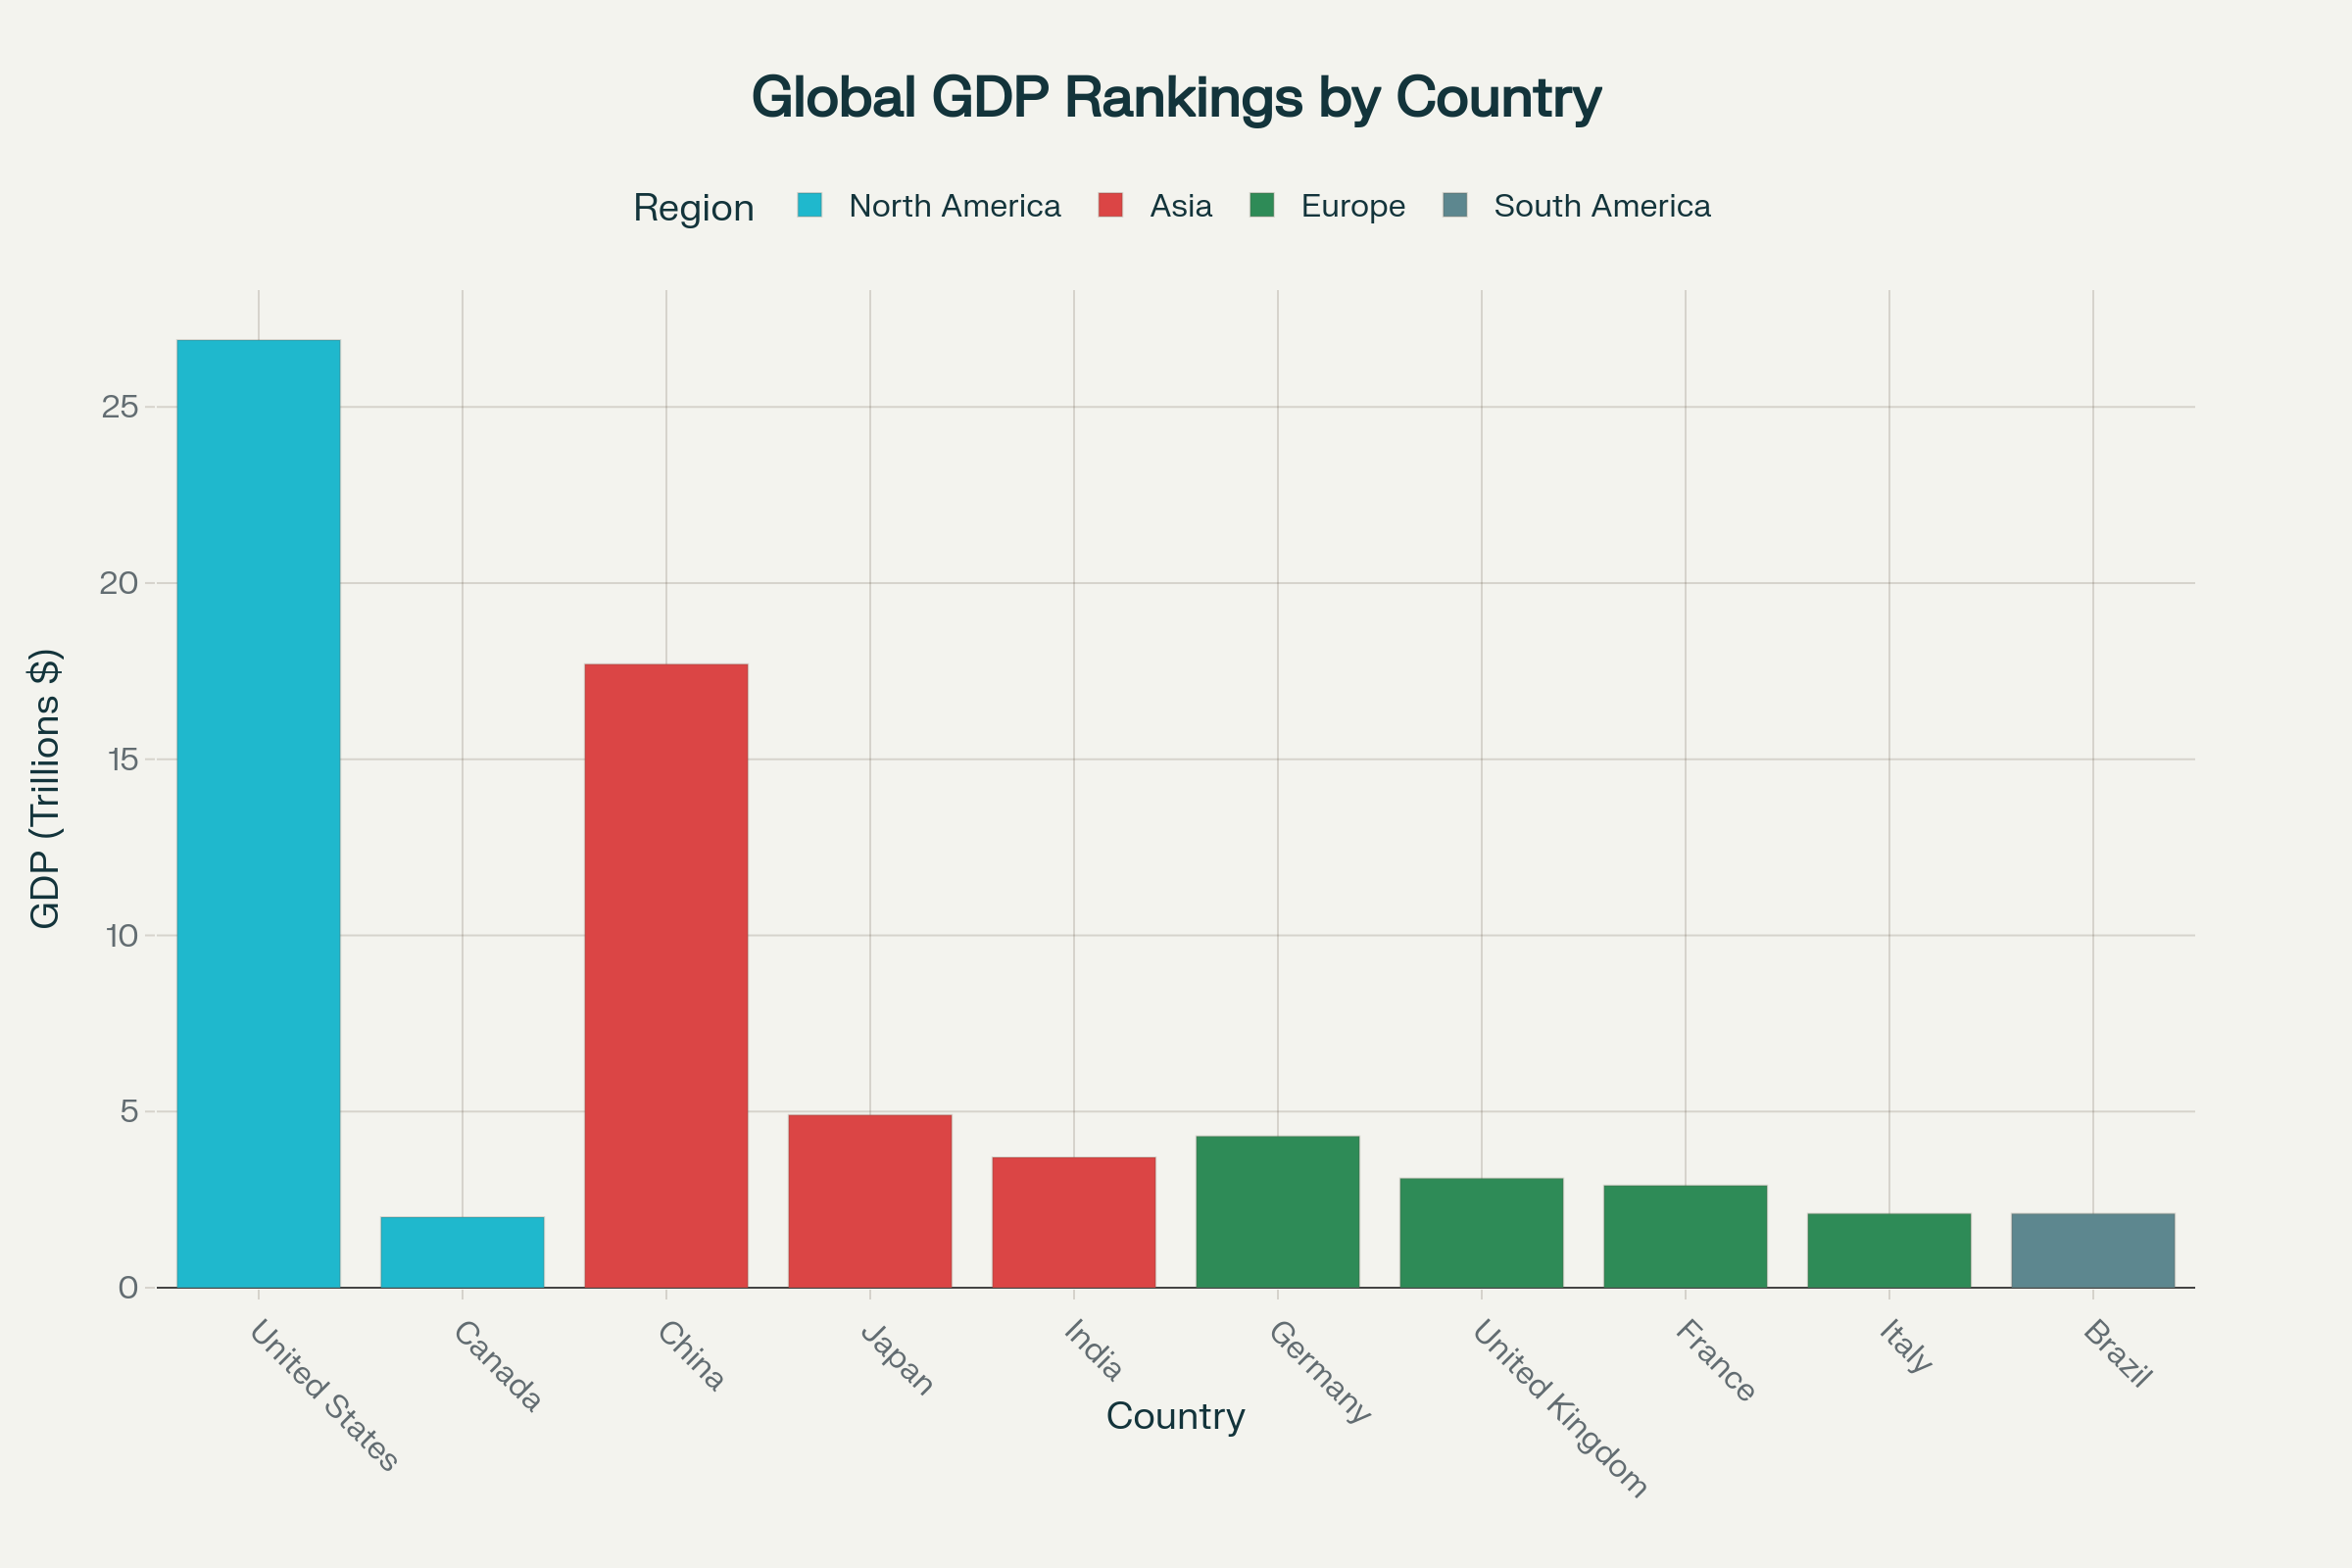
- 🌍 Top countries by GDP and GDP per capita
- 📊 Growth trends over time and economic cycles
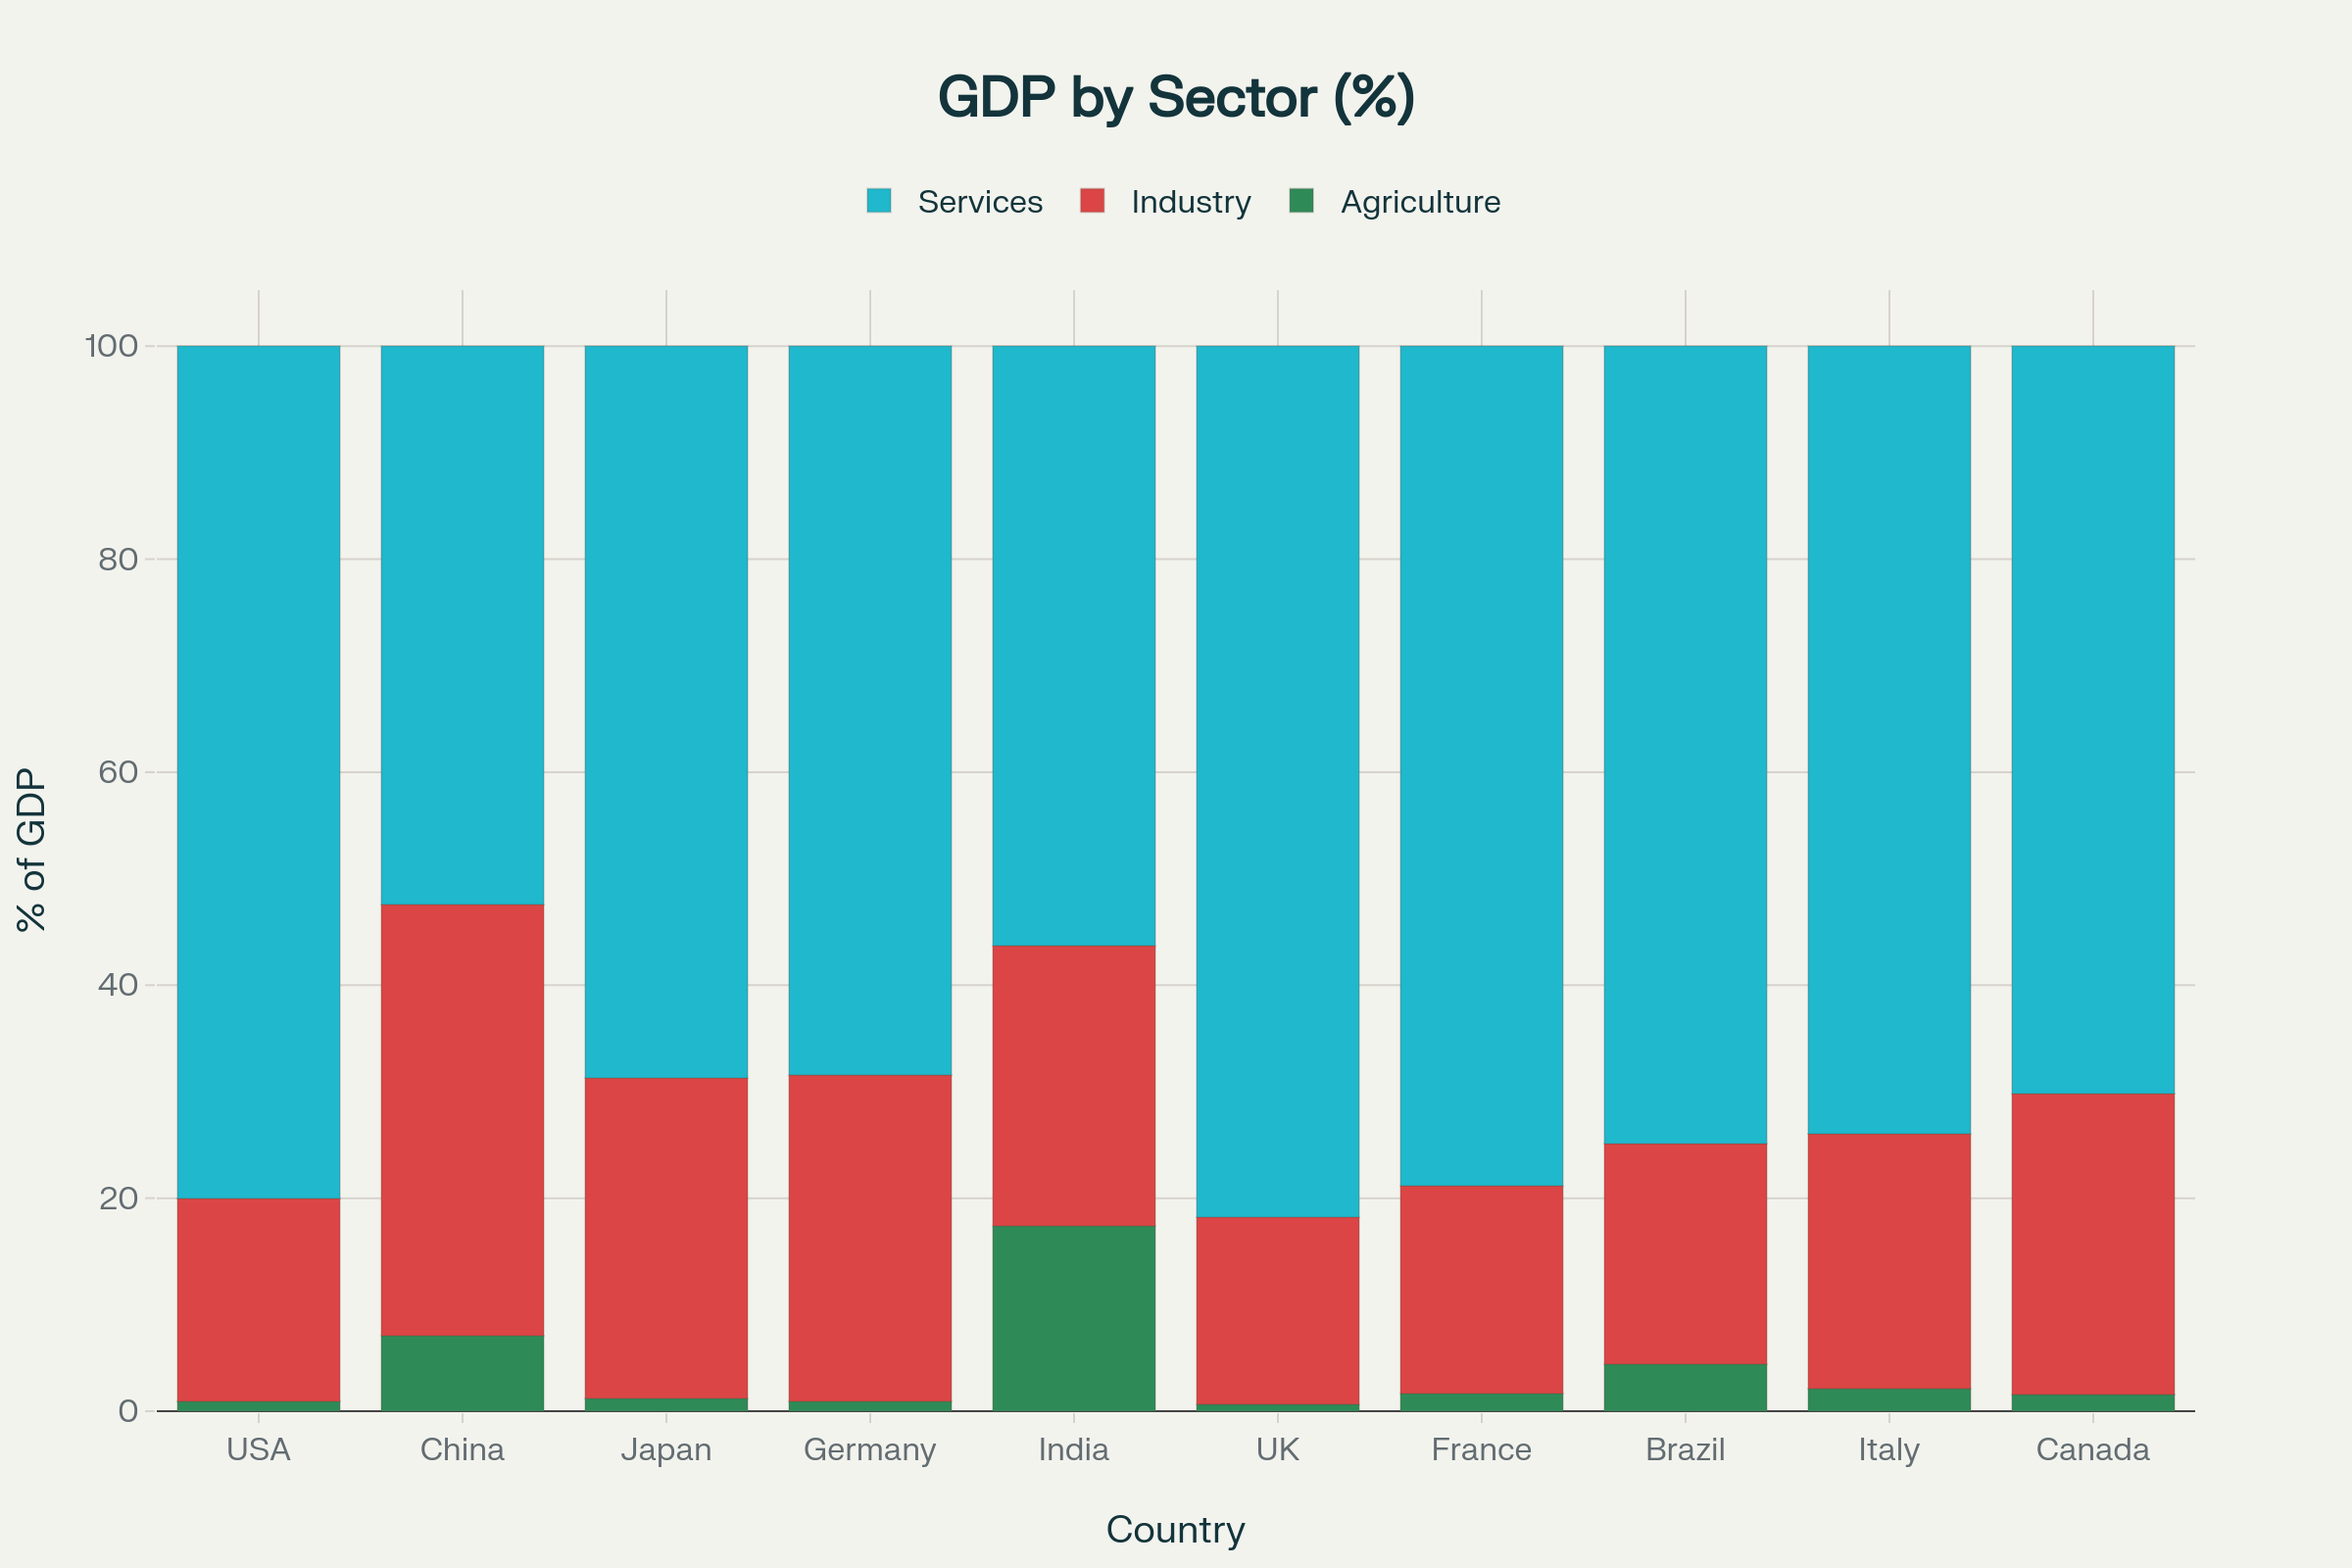
- 💼 Sector-wise contributions to national GDP
- 💡 Regional economic comparisons
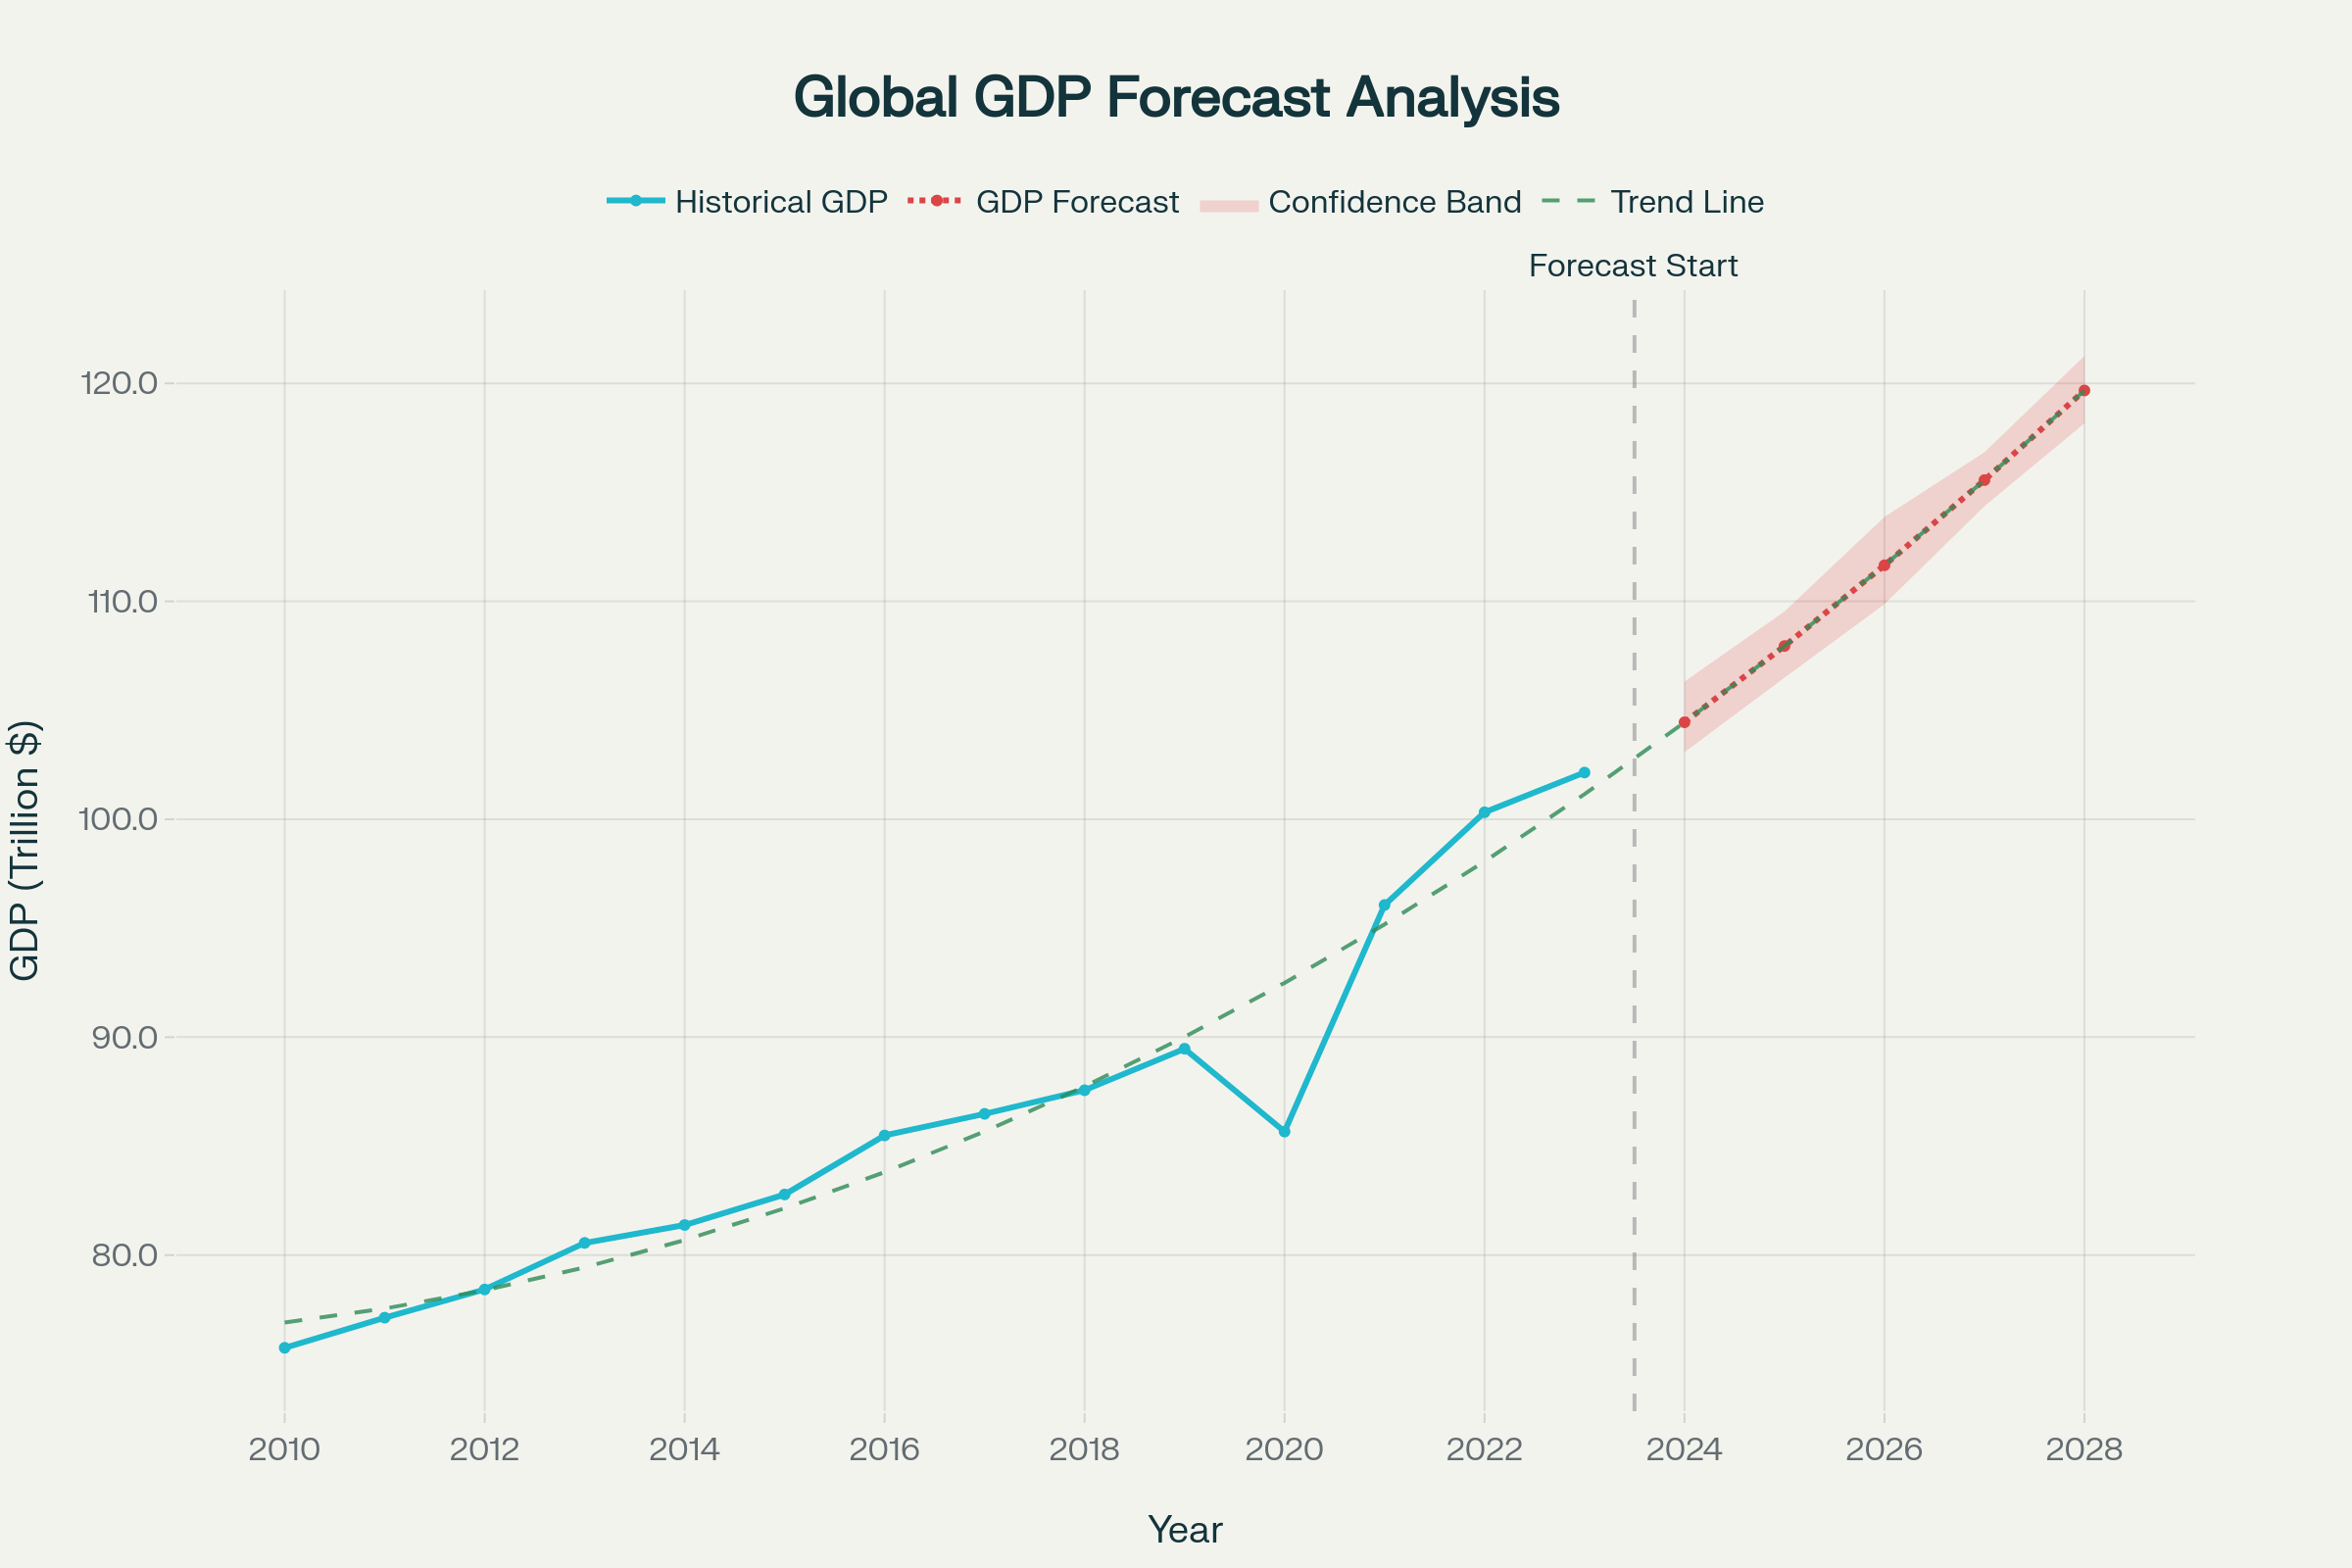
- 📈 Forecasted GDP growth for strategic planning
Outcomes
- Interactive dashboards for economic monitoring and comparison
- Understanding of country-level and sector-level performance
- Data-driven insights for policymaking, investment, and planning
When:
2024
Mode:
Power BI & Python Analysis
Dataset:
Global GDP Data
Focus:
Economics & Business Analytics
Project Snapshots
Business Impact
📈 Identified top-performing countries and sectors for economic planning and investment.
💡 Provided insights into GDP trends, growth, and sector contributions to support policy decisions.
🌍 Helped visualize regional disparities and global economic patterns for strategic planning.
Challenges & Learnings
⚡ Cleaning and harmonizing GDP data across multiple years, sources, and countries.
📊 Designing dashboards to compare multiple economic indicators clearly and interactively.
🚀 Learned advanced data visualization, forecasting, and economic analysis techniques.