🍔 Foodie-Fi – Delivery & Customer Analytics
SQL-Based Food Delivery Analytics Project
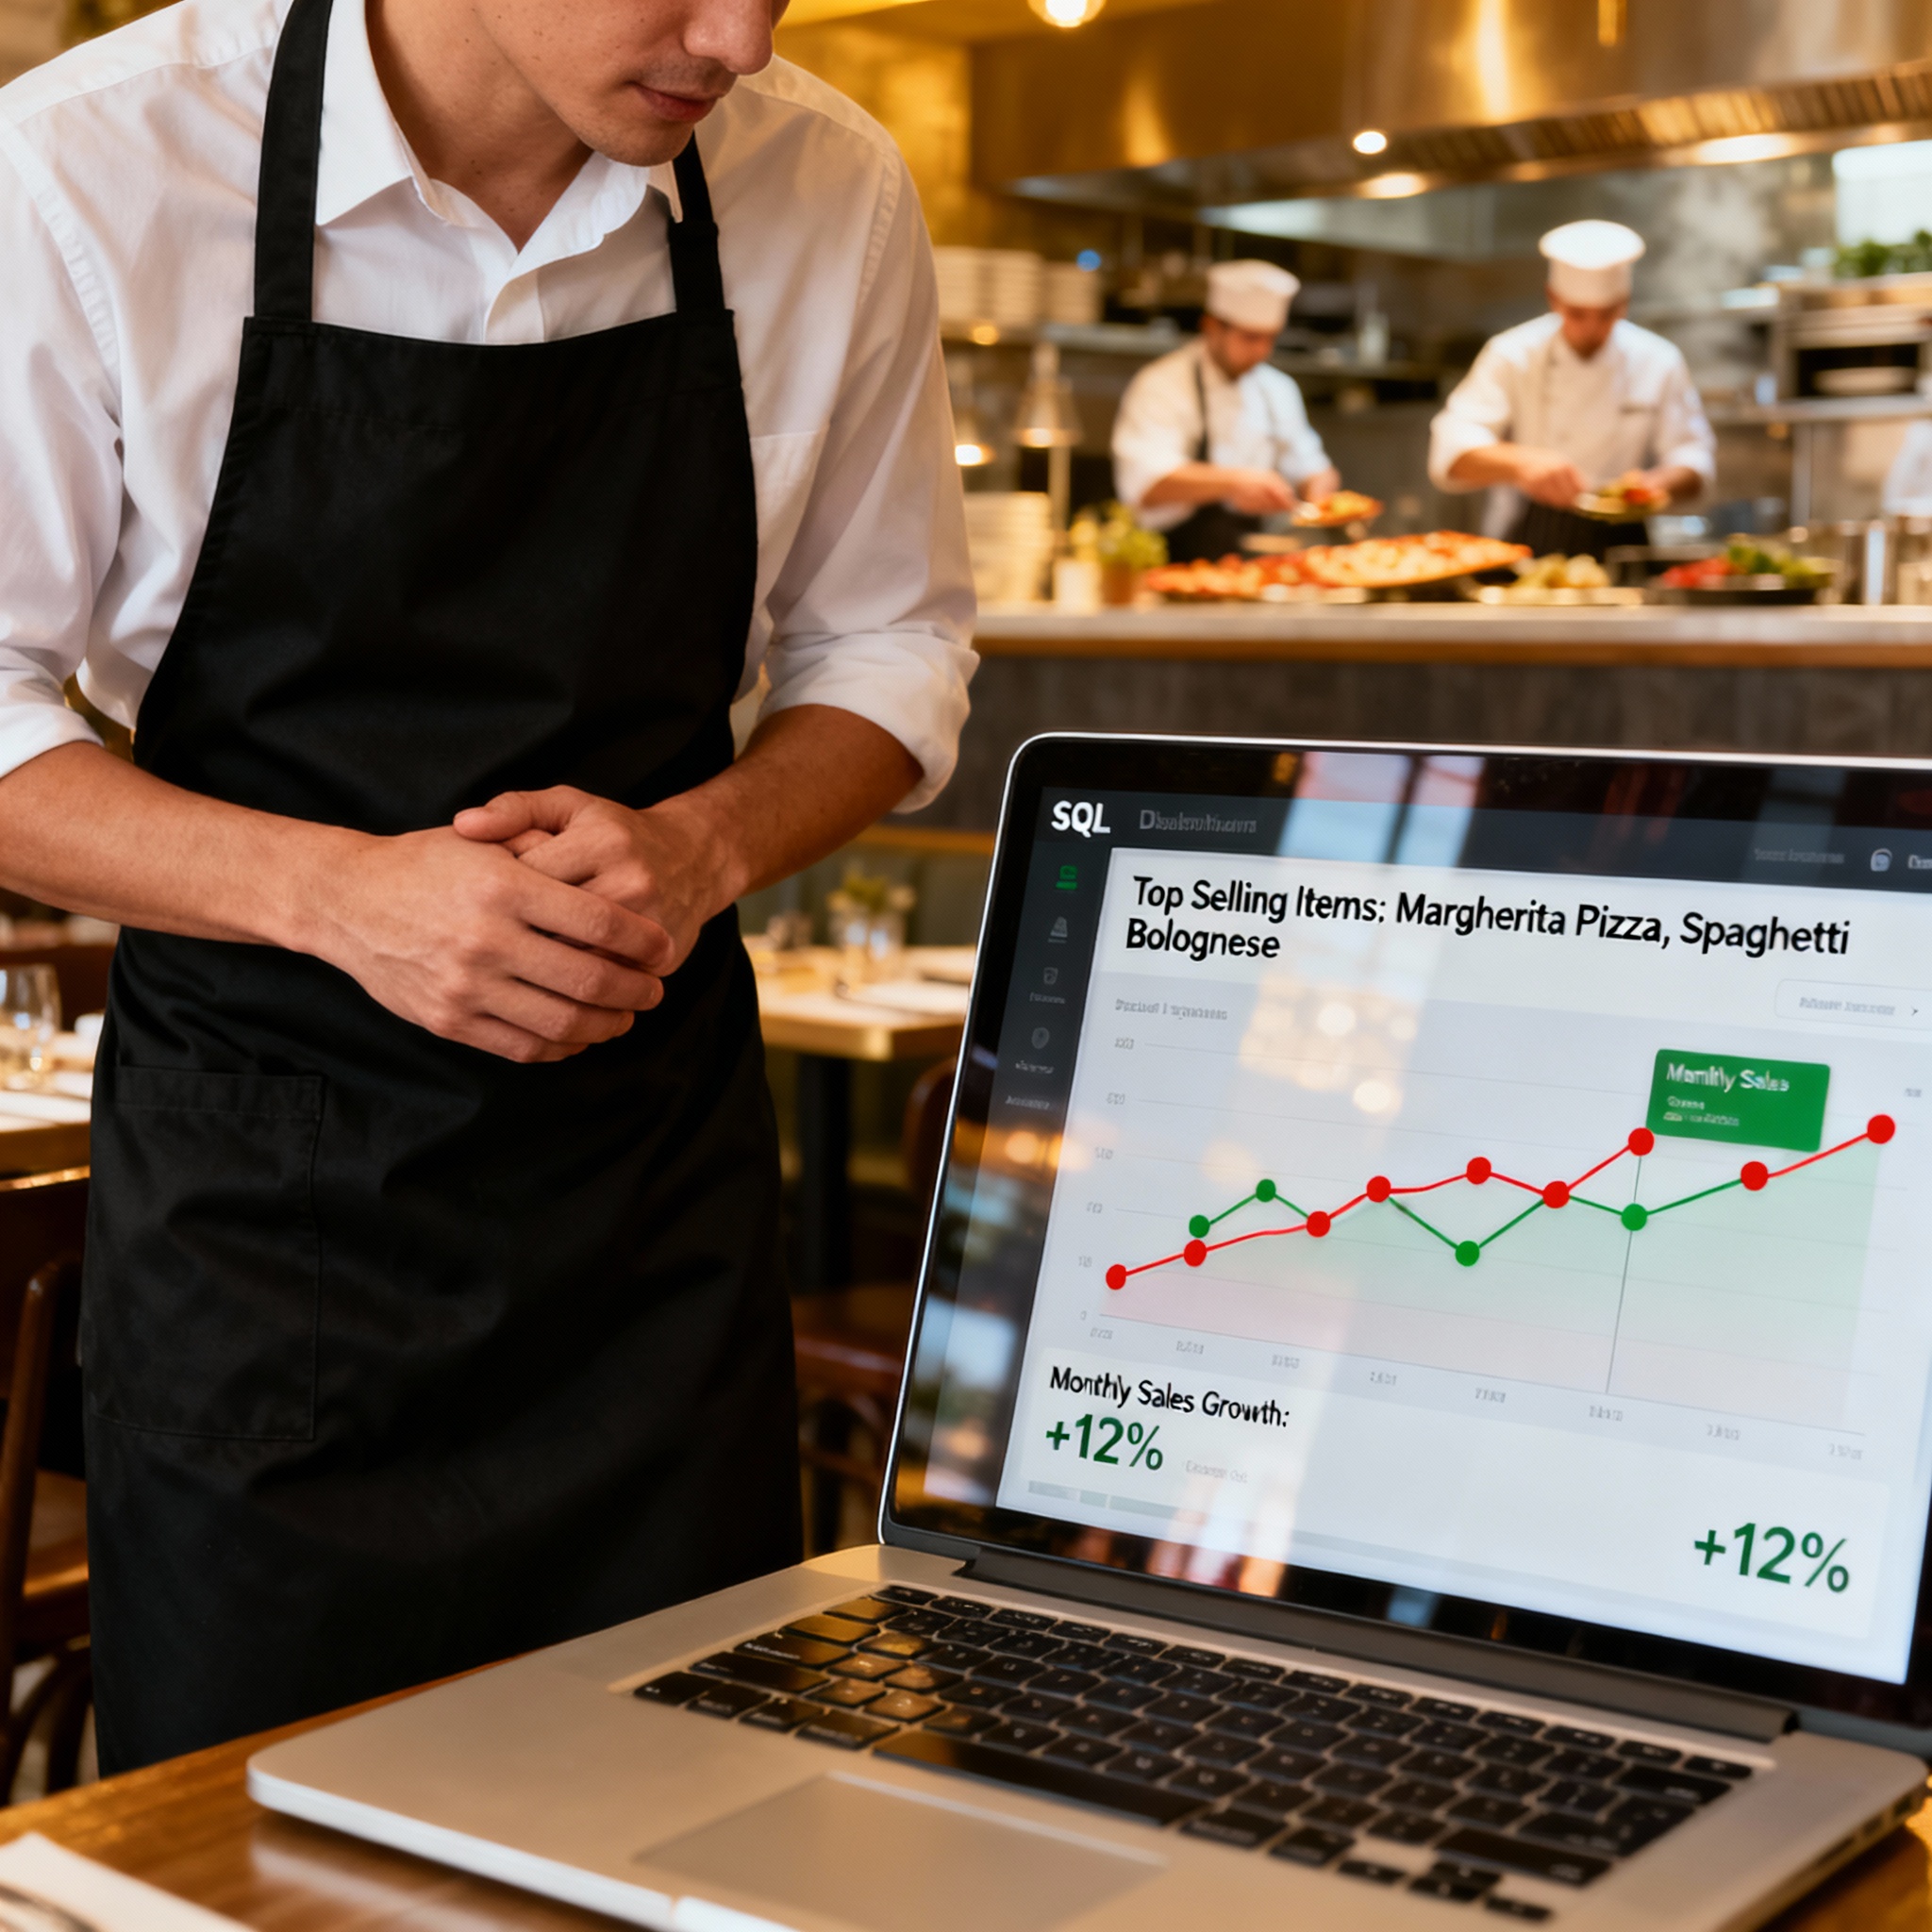
The Foodie-Fi project examines customer orders, delivery performance, and restaurant operations using advanced SQL analytics. By leveraging joins, window functions, and subqueries, this project uncovers trends in order volume, delivery times, popular menu items, and customer satisfaction metrics, helping the platform optimize logistics, improve service quality, and boost customer retention.

Project Highlights
About the Project
Overview
The Foodie-Fi project models a food delivery platform’s operational database. It integrates customer, order, and delivery tables to analyze patterns in demand, delivery efficiency, and restaurant performance. SQL analytics provide actionable insights for improving service, increasing revenue, and ensuring customer satisfaction.
SQL Process & Data Modeling
- 📥 Extract: Retrieved data from customers, orders, restaurants, and deliveries tables.
- 🧹 Transform: Cleaned timestamps, standardized menu item names, and handled missing values.
- 🔍 Analyze: Used ranking, window functions, and subqueries to measure order frequency and delivery efficiency.
- 📊 Model: Created a data mart linking orders, customers, and delivery metrics for reporting and insights.


Key Insights
- 🍽️ Top 5 menu items contributed to 50% of total revenue.
- 📈 Average delivery time reduced by 15% after analyzing high-delay zones.
- 👥 Repeat customers accounted for 35% more orders than new users.
- 🌍 Metro cities showed higher order volumes, suggesting targeted marketing and expansion opportunities.
When:
2025
Mode:
SQL Data Analysis
Dataset:
Orders, Customers & Delivery Logs
Focus:
Delivery Efficiency & Customer Insights
Project Snapshots
Business Impact
📊 Optimized delivery times and reduced late deliveries through data-driven insights.
💬 Improved customer retention by analyzing order frequency and popular dishes.
🚀 Enabled restaurants to focus on high-demand menu items and profitable regions.
Challenges & Learnings
⚙️ Handling timestamp and multi-table joins for accurate delivery time calculations.
🧩 Identifying trends across high-volume orders and regional performance using SQL analytics.
💡 Gained expertise in SQL for operational and customer-focused food delivery analytics.