Adventure Works Sales Analysis
Business Analytics Project
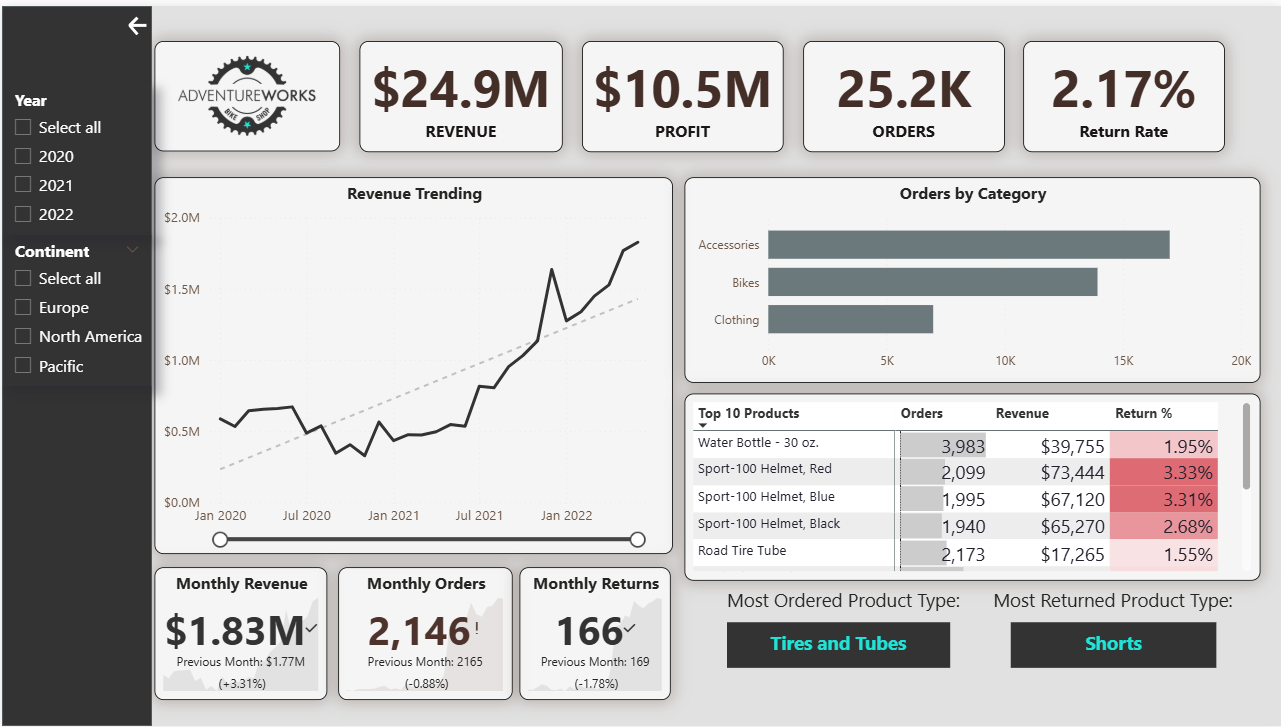
The Adventure Works Sales Analysis project focuses on analyzing sales and returns data from the Adventure Works dataset to uncover customer behavior, product performance, and regional trends. Using Power BI, the project transforms raw transactional data into interactive dashboards, enabling businesses to track KPIs such as sales revenue, order quantities, product returns, and customer segments.
Project Highlights
About the Project
Overview
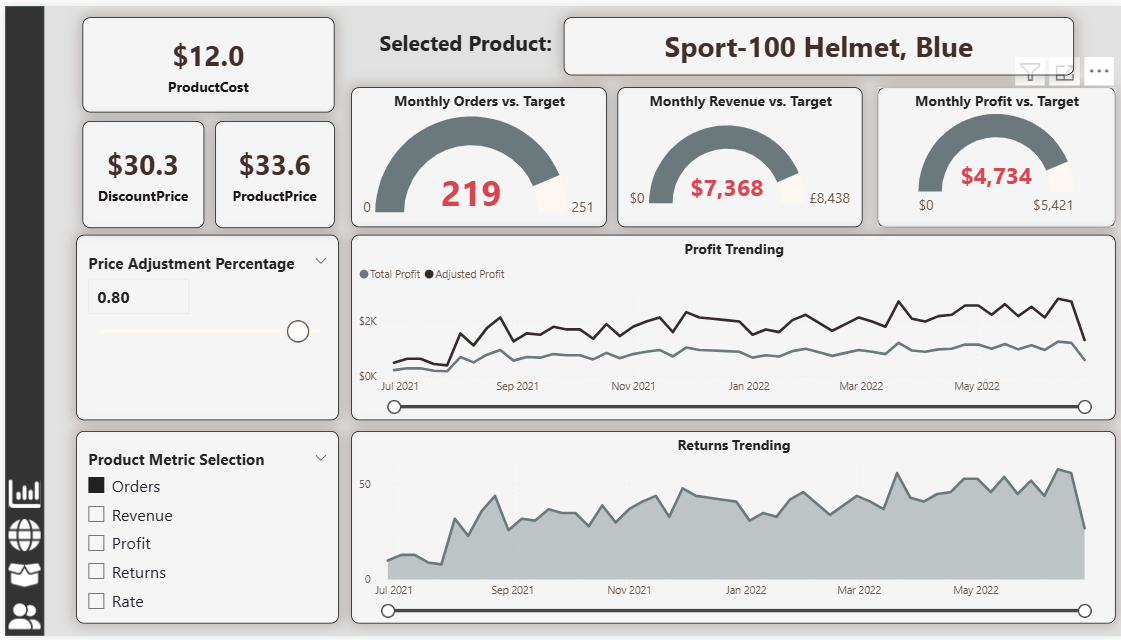
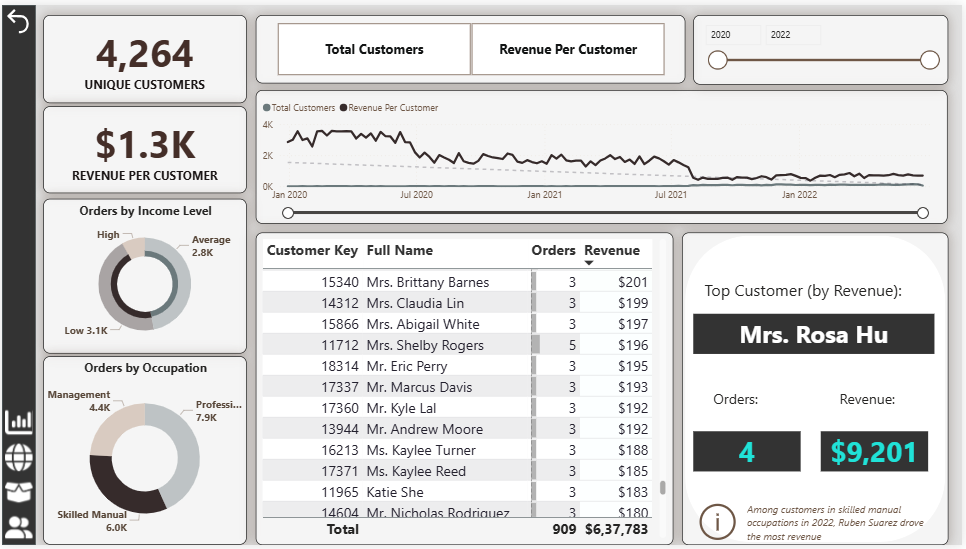
This Adventure Works Sales Analysis project demonstrates how Power BI can convert raw transactional and master data into actionable insights. The solution enables managers to track sales KPIs, product trends, customer behavior, and returns in real-time.
Key Insights
- 📦 Top-selling products and categories
- 📊 Sales revenue trends and peak order periods
- 🚚 Returns and their impact on revenue
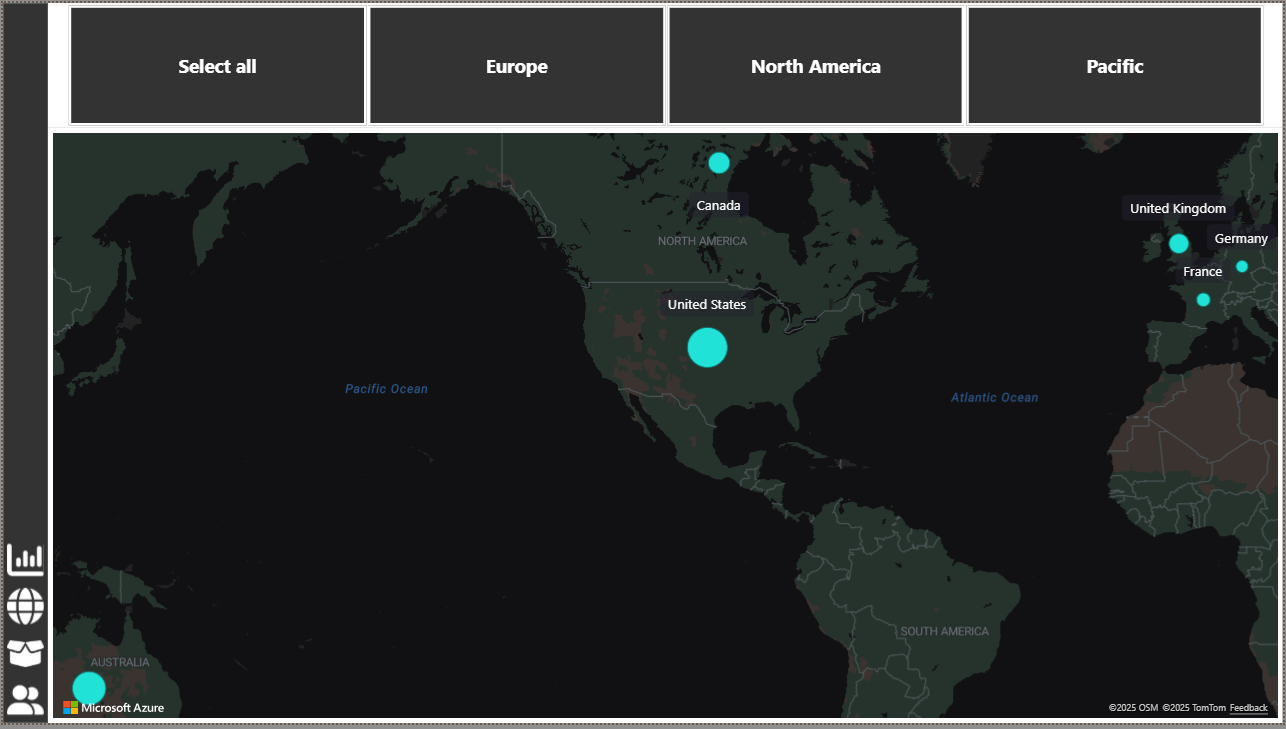
- 🌍 Regional and territory-wise sales analysis
- 👥 Customer segmentation based on demographics and purchase patterns
The dashboards provide business teams and managers with insights to make data-driven decisions for improving sales performance, inventory management, and customer satisfaction.
Outcomes
- Interactive dashboards for sales and management decision-making
- Improved understanding of customer behavior and product performance
- Optimized inventory, returns management, and regional sales strategies
By the end, the project showcased how data analytics can enhance sales efficiency, profitability, and operational performance for a global business.
When:
2024
Mode:
Power BI Dashboard
Dataset:
Adventure Works Sales Data
Focus:
Business Analytics
Project Snapshots
Business Impact
📈 Helped Adventure Works identify high-performing products and regions to optimize marketing and inventory.
💡 Improved customer satisfaction by analyzing purchase patterns and product availability.
💰 Reduced losses from product returns and maximized revenue opportunities across territories.
Challenges & Learnings
⚡ Cleaning and integrating large transactional data with multiple dimension tables.
📊 Designing dashboards that provide clarity while handling complex relationships and KPIs.
🚀 Learned best practices in data modeling and building scalable Power BI solutions for large datasets.